

Question: NOTE: NEED CODE IN NUMPY: Links: this introductory : https://queue-it.com/blog/queuing-theory/ here: https://en.wikipedia.org/wiki/M/M/1_queue You are asked to stress test an cloud API endpoint and are told
NOTE: NEED CODE IN NUMPY:
Links: this introductory : https://queue-it.com/blog/queuing-theory/
here: https://en.wikipedia.org/wiki/M/M/1_queue
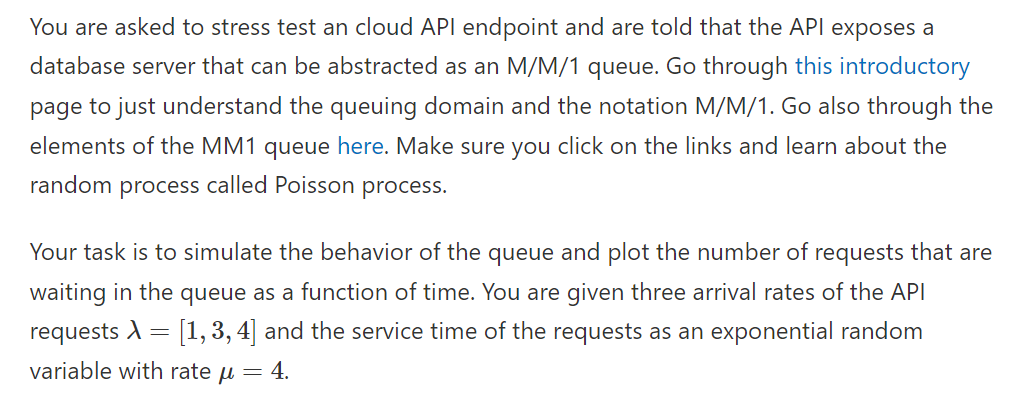
You are asked to stress test an cloud API endpoint and are told that the API exposes a database server that can be abstracted as an M/M/1 queue. Go through this introductory page to just understand the queuing domain and the notation M/M/1. Go also through the elements of the MM1 queue here. Make sure you click on the links and learn about the random process called Poisson process. Your task is to simulate the behavior of the queue and plot the number of requests that are waiting in the queue as a function of time. You are given three arrival rates of the API requests =[1,3,4] and the service time of the requests as an exponential random variable with rate =4
Step by Step Solution
There are 3 Steps involved in it

Get step-by-step solutions from verified subject matter experts