

Question: NOTE Part 2 Challenge Problem: 2.34 Page 78 Marathon winners. The histogram and box plots below show the distribution of finishing times for male
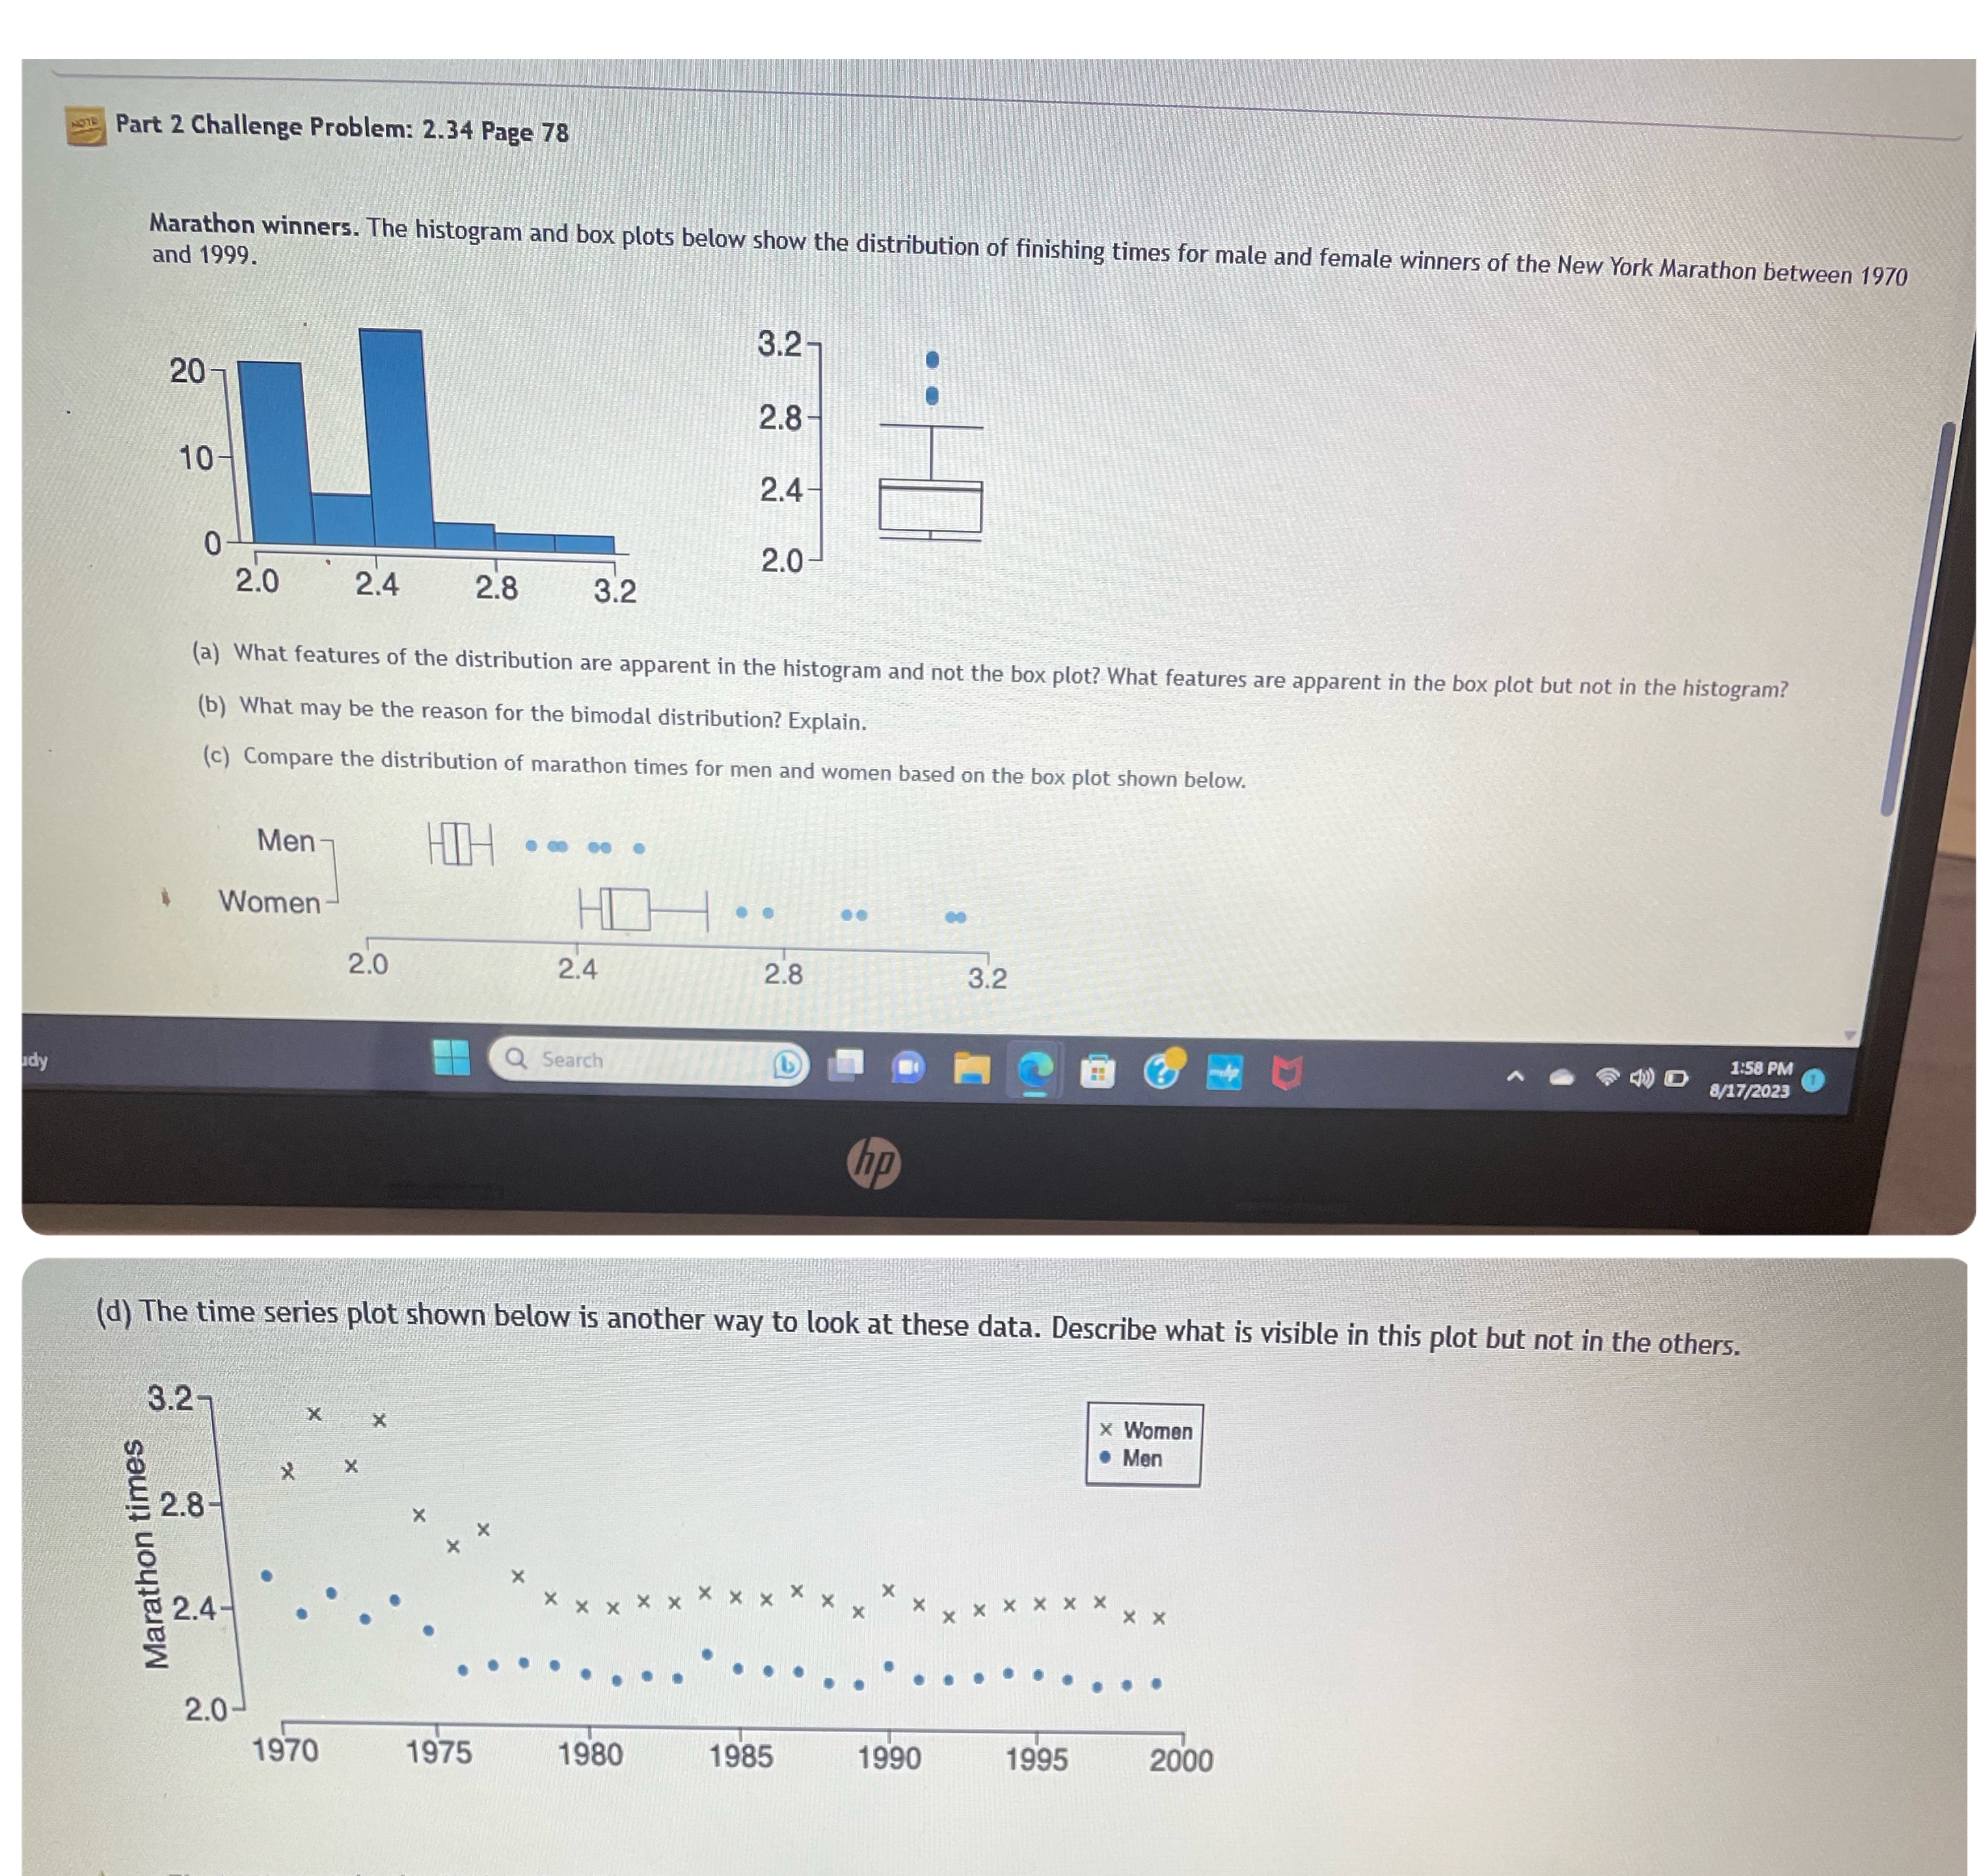
NOTE Part 2 Challenge Problem: 2.34 Page 78 Marathon winners. The histogram and box plots below show the distribution of finishing times for male and female winners of the New York Marathon between 1970 and 1999. dy 3.2- 201 2.8- 10- 2.4 0 2.0 2.0 2.4 2.8 3.2 (a) What features of the distribution are apparent in the histogram and not the box plot? What features are apparent in the box plot but not in the histogram? (b) What may be the reason for the bimodal distribution? Explain. (c) Compare the distribution of marathon times for men and women based on the box plot shown below. Men- Women 2.0 HIH 2.4 2.8 3.2 Q Search L hp D 1:58 PM 8/17/2023 (d) The time series plot shown below is another way to look at these data. Describe what is visible in this plot but not in the others. 3.2 * X 2.8 Marathon times 2.4- X X x x x x X X x x Women Men X X X X 2.0 1970 1975 1980 1985 1990 1995 2000
Step by Step Solution
There are 3 Steps involved in it

Get step-by-step solutions from verified subject matter experts