

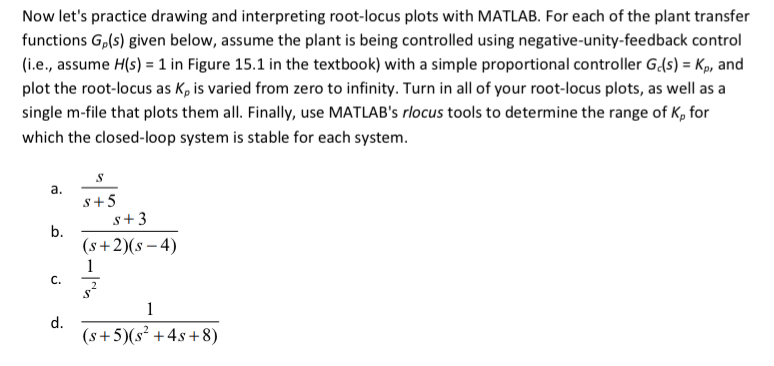
Question: Now let's practice drawing and interpreting root - locus plots with MATLAB. For each of the plant transfer functions G ( s ) given below,
Now let's practice drawing and interpreting rootlocus plots with MATLAB. For each of the plant transfer functions given below, assume the plant is being controlled using negativeunityfeedback control ie assume in Figure in the textbook with a simple proportional controller and plot the rootlocus as is varied from zero to infinity. Turn in all of your rootlocus plots, as well as a single file that plots them all. Finally, use MATLAB's rlocus tools to determine the range of for which the closedloop system is stable for each system.
a
b
c
d
Step by Step Solution
There are 3 Steps involved in it
1 Expert Approved Answer
Step: 1 Unlock

Question Has Been Solved by an Expert!
Get step-by-step solutions from verified subject matter experts
Step: 2 Unlock
Step: 3 Unlock