

Question: OBJ. 2,3,4,5 3. 30,000 PR 21-68 Contribution margin, break-even sales, cost-volume-profit chart, margin of safety, and operating leverage Baker Co. expects to maintain the same
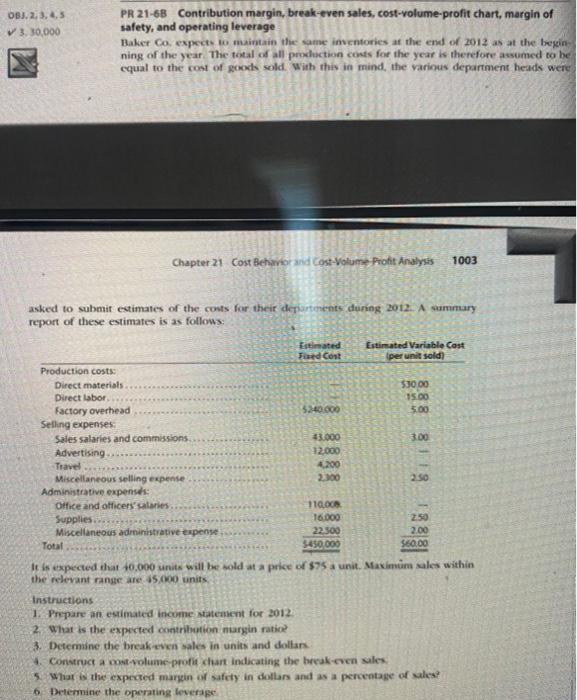
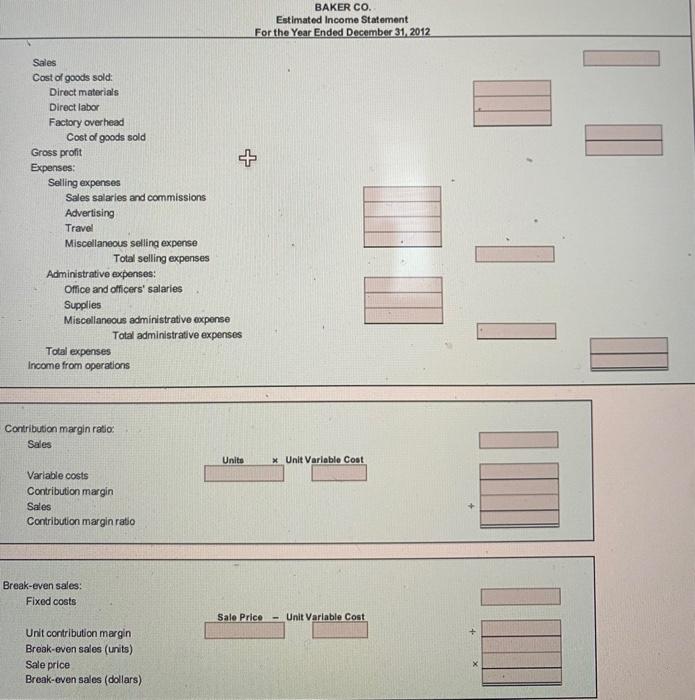
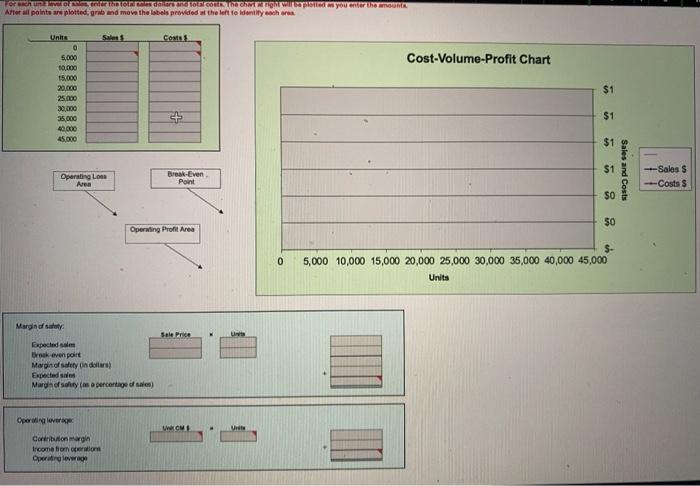
OBJ. 2,3,4,5 3. 30,000 PR 21-68 Contribution margin, break-even sales, cost-volume-profit chart, margin of safety, and operating leverage Baker Co. expects to maintain the same inventories at the end of 2012 as at the begin ning of the year. The total of all production costs for the year is therefore assumed to be equal to the cost of goods sold. With this in mind, the various department heads were Chapter 21 Cost Behavior and cost-Volume Profit Analysis 1003 asked to submit estimates of the costs for their departments during 2012 A summary report of these estimates is as follows: | mated Estimated Variable Cast Fed Cost per unit sold) Production costs Direct materials 53000 Direct labor 15.00 factory overhead 5240.000 5.00 Selling expenses. Sales salaries and commissions 33.000 Advertising 12.000 Travel 4200 Miscellaneous selling expense 2.300 2.50 Administrative expenses Office and officers salaries. 110.00 Supplies 16.000 2.50 Miscellaneous administrative expense 22.500 2.00 Total 5450.000 560.00 It is expected that 10,000 units will be sold at a price of $75 a unit. Maximum sales within the relevant range are 15.000 units instructions 1. Prepare an estimated income statentent for 2012 2. What is the expected contribution nurgin ratio 3. Determine the break even sales in units and dollar 4. Construct a cost volume profit chart Indicating the break even sales 5. What is the expected margin of safety in dollars and as a percentage of sales? 6. Determine the operating leverage BAKER CO. Estimated Income Statement For the Year Ended December 31, 2012 Sales Cost of goods sold Direct materials Direct labor Factory overhead Cost of goods sold Gross profit + Expenses: Selling expenses Sales salaries and commissions Advertising Travel Miscellaneous selling expense Total selling expenses Administrative expenses: Office and officers' salaries Supplies Miscellaneous administrative expense Total administrative expenses Total expenses Income from operations INNOT Contribution margin ratio: Sales Unito x Unit Variable Cost Variable costs Contribution margin Sales Contribution margin ratio Break-even sales: Fixed costs Sale Price - Unit Variable Cost Unit contribution margin Break-even sales (units) Sale price Break-even sales (dollars) orah CIRI CIRI CIOCU you enter the After all points are plotted, grand move the labels provided at the left to identity ache Costas Cost-Volume-Profit Chart a 5.000 10,000 15,000 20,000 25,000 30,000 35.000 40,000 45,000 $1 1 + $1 $1 $1 Sales and Costs Operating Los Area Break Even Point ---Sales ---Costs $ 50 $0 Operating Profit Area 0 $- 5,000 10,000 15,000 20,000 25,000 30,000 35,000 40,000 45,000 Units Margind sately Ut Expected Brock even point Margin of sy ondor) Expected sales Margin Soy (as a percentage of sales Opering over OMI Unit Contribong Income from acron Operating lever OBJ. 2,3,4,5 3. 30,000 PR 21-68 Contribution margin, break-even sales, cost-volume-profit chart, margin of safety, and operating leverage Baker Co. expects to maintain the same inventories at the end of 2012 as at the begin ning of the year. The total of all production costs for the year is therefore assumed to be equal to the cost of goods sold. With this in mind, the various department heads were Chapter 21 Cost Behavior and cost-Volume Profit Analysis 1003 asked to submit estimates of the costs for their departments during 2012 A summary report of these estimates is as follows: | mated Estimated Variable Cast Fed Cost per unit sold) Production costs Direct materials 53000 Direct labor 15.00 factory overhead 5240.000 5.00 Selling expenses. Sales salaries and commissions 33.000 Advertising 12.000 Travel 4200 Miscellaneous selling expense 2.300 2.50 Administrative expenses Office and officers salaries. 110.00 Supplies 16.000 2.50 Miscellaneous administrative expense 22.500 2.00 Total 5450.000 560.00 It is expected that 10,000 units will be sold at a price of $75 a unit. Maximum sales within the relevant range are 15.000 units instructions 1. Prepare an estimated income statentent for 2012 2. What is the expected contribution nurgin ratio 3. Determine the break even sales in units and dollar 4. Construct a cost volume profit chart Indicating the break even sales 5. What is the expected margin of safety in dollars and as a percentage of sales? 6. Determine the operating leverage BAKER CO. Estimated Income Statement For the Year Ended December 31, 2012 Sales Cost of goods sold Direct materials Direct labor Factory overhead Cost of goods sold Gross profit + Expenses: Selling expenses Sales salaries and commissions Advertising Travel Miscellaneous selling expense Total selling expenses Administrative expenses: Office and officers' salaries Supplies Miscellaneous administrative expense Total administrative expenses Total expenses Income from operations INNOT Contribution margin ratio: Sales Unito x Unit Variable Cost Variable costs Contribution margin Sales Contribution margin ratio Break-even sales: Fixed costs Sale Price - Unit Variable Cost Unit contribution margin Break-even sales (units) Sale price Break-even sales (dollars) orah CIRI CIRI CIOCU you enter the After all points are plotted, grand move the labels provided at the left to identity ache Costas Cost-Volume-Profit Chart a 5.000 10,000 15,000 20,000 25,000 30,000 35.000 40,000 45,000 $1 1 + $1 $1 $1 Sales and Costs Operating Los Area Break Even Point ---Sales ---Costs $ 50 $0 Operating Profit Area 0 $- 5,000 10,000 15,000 20,000 25,000 30,000 35,000 40,000 45,000 Units Margind sately Ut Expected Brock even point Margin of sy ondor) Expected sales Margin Soy (as a percentage of sales Opering over OMI Unit Contribong Income from acron Operating lever
Step by Step Solution
There are 3 Steps involved in it

Get step-by-step solutions from verified subject matter experts