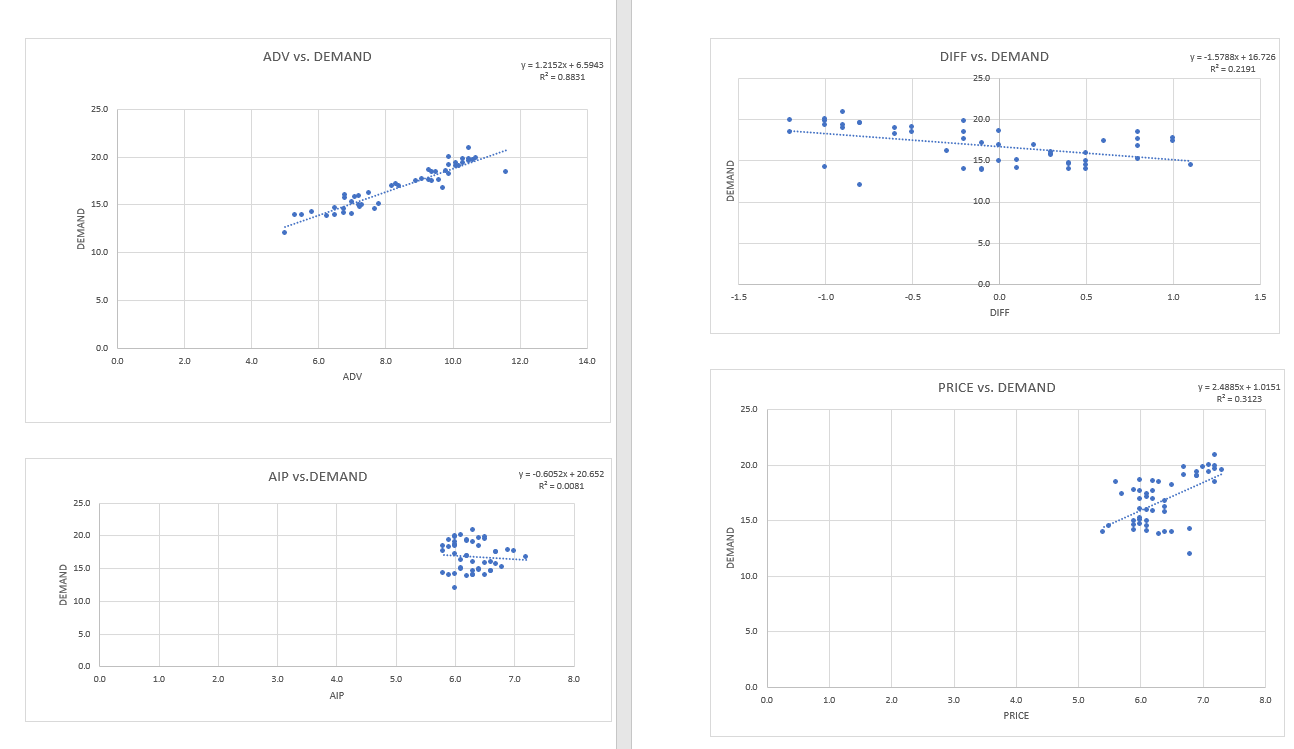
Question: Observe graphs and provide interpretation. Note that Demand is always on the Y axis ADV vs. DEMAND DIFF VS. DEMAND y = 1.2152x + 6.5943

  1. Observe graphs and provide interpretation. Note that Demand is always on the Y axisObserve graphs and provide interpretation. Note
ADV vs. DEMAND DIFF VS. DEMAND y = 1.2152x + 6.5943 P=0.8831 y = -1.5788x + 16.726 R = 0.2191 25.0 25.0 20.0 . 20.0 15.0 DEMAND 15.0 10.0 DEMAND 5.0 10.0 5.0 -1.5 -1.0 -0.5 0.5 1.0 1.5 0.0 DIFF 0.0 0.0 2.0 4.0 6.0 8.0 10.0 12.0 14.0 ADV PRICE VS. DEMAND y = 2.4885x + 1.0151 R=0.3123 25.0 20.0 AIP vs.DEMAND y = -0.6052x+ 20.652 R = 0.0081 25.0 15.0 20.0 DEMAND 15.0 10.0 DEMAND 10.0 5.0 5.0 0.0 0.0 1.0 2.0 3.0 4.0 5.0 6.0 7.0 8.0 AIP 0.0 0.0 1.0 2.0 3.0 4.0 5.0 6.0 7.0 8.0 PRICE

Step by Step Solution

There are 3 Steps involved in it

1 Expert Approved Answer
Step: 1 Unlock blur-text-image
Question Has Been Solved by an Expert!

Get step-by-step solutions from verified subject matter experts

Step: 2 Unlock
Step: 3 Unlock

Students Have Also Explored These Related General Management Questions!