

Question: Observation Number Sample Size (n) Factor for X-bar (A2) Factor for LCL for R (D3) Factor for UCL for R (D4) 0 2 3 0
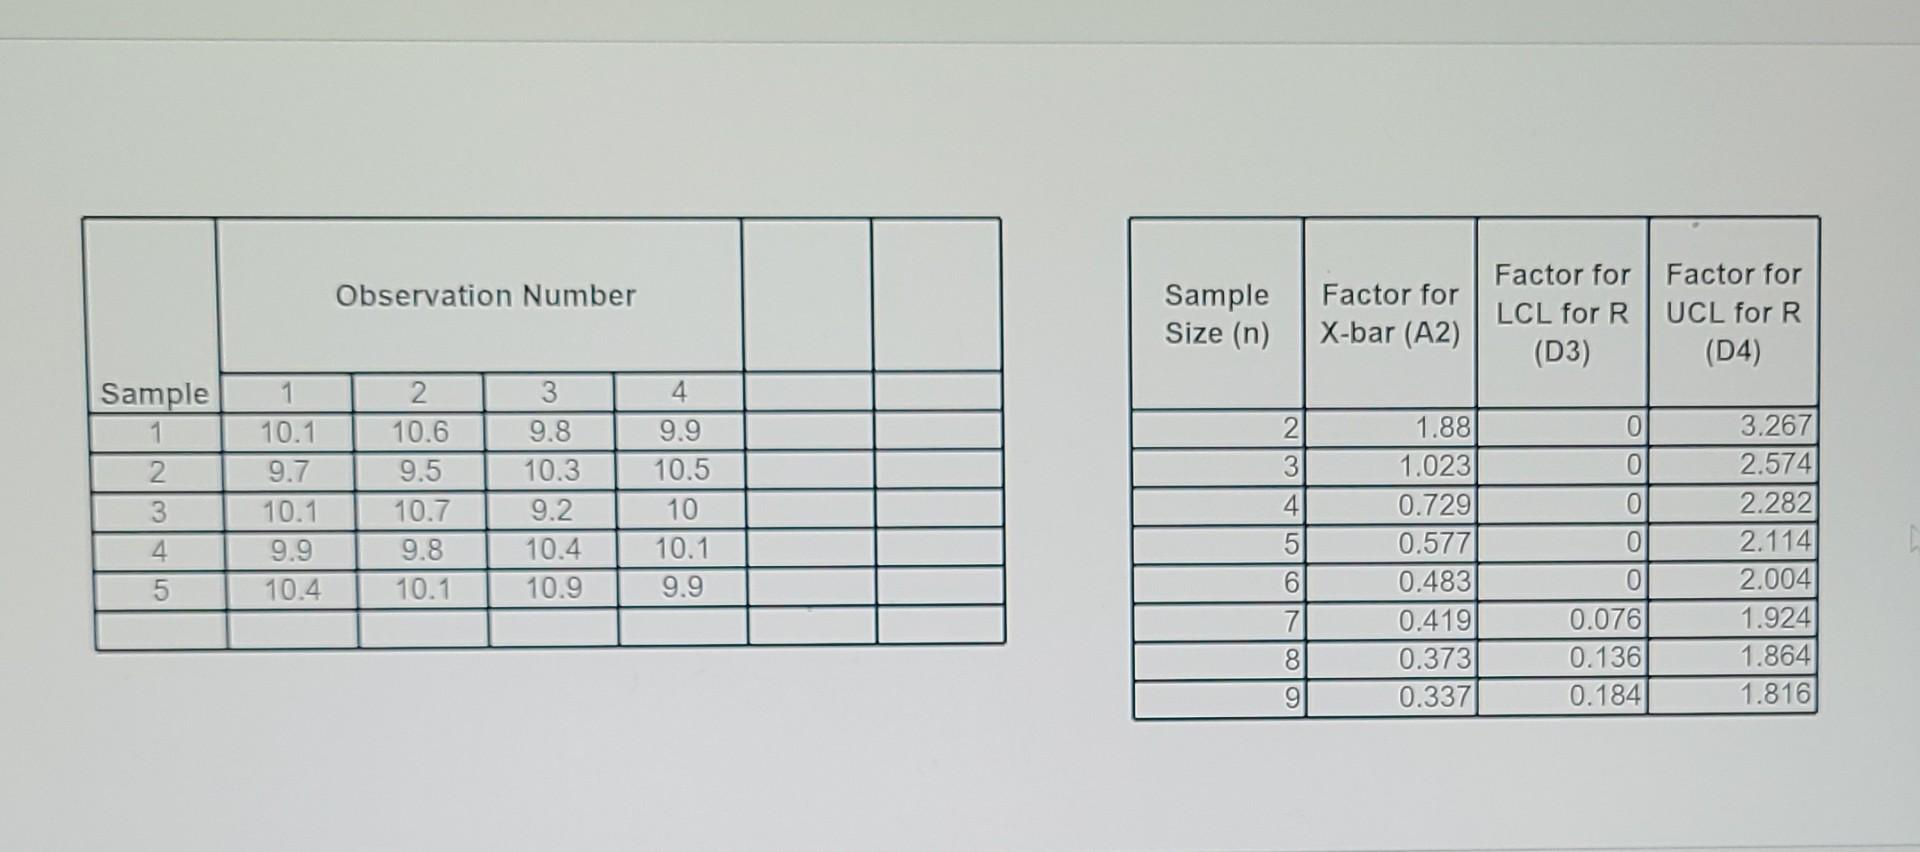
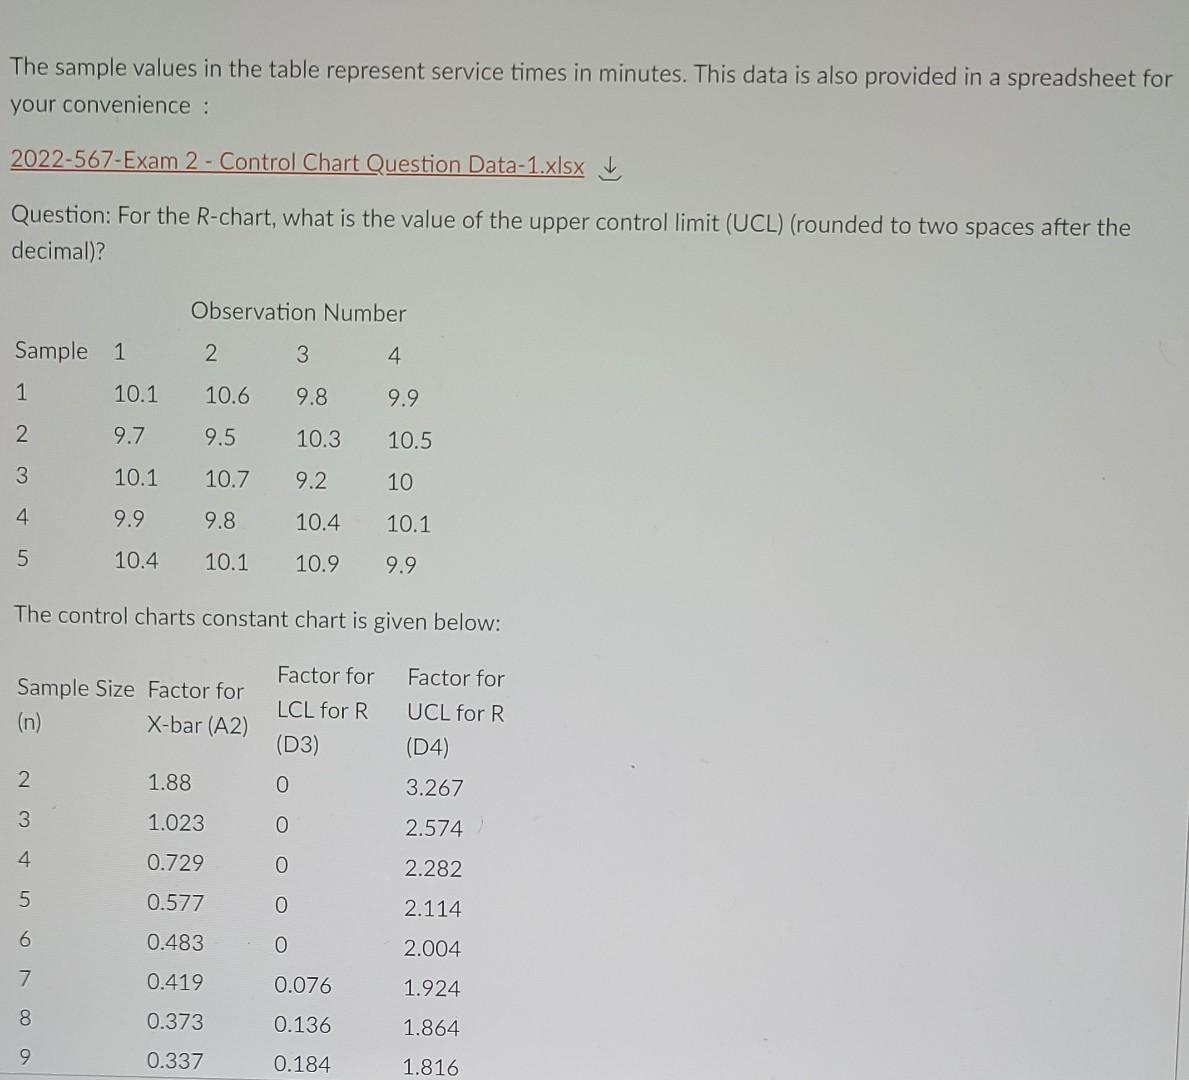
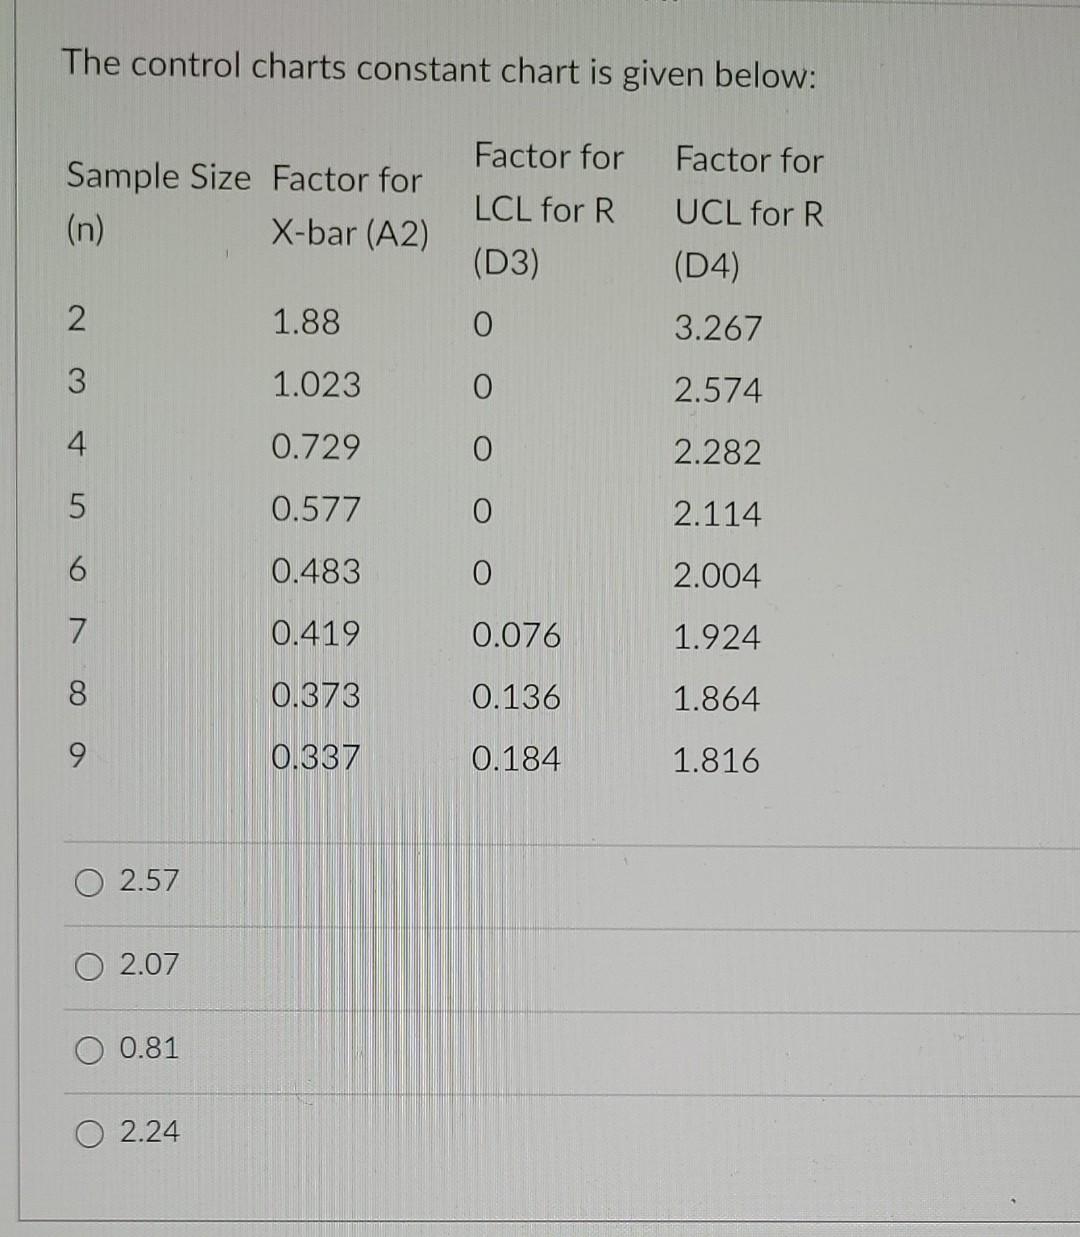
Observation Number Sample Size (n) Factor for X-bar (A2) Factor for LCL for R (D3) Factor for UCL for R (D4) 0 2 3 0 Sample 1 2 3 4 5 1 10.1 9.7 10.1 9.9 10.4 2 10.6 9.5 10.7 9.8 10.1 3 9.8 10.3 9.2 10.4 10.9 4 9.9 10.5 10 10.1 9.9 4 0 5 0 1.88 1.023 0.729 0.577 0.483 0.419 0.373 0.337 3.267 2.574 2.282 2.114 2.004 1.924 1.864 1.816 0 6 7 8 0.076 0.136 0.184 9 The sample values in the table represent service times in minutes. This data is also provided in a spreadsheet for your convenience : 2022-567-Exam 2 - Control Chart Question Data-1.xlsx Question: For the R-chart, what is the value of the upper control limit (UCL) (rounded to two spaces after the decimal)? Observation Number Sample 1 2 3 4 1 10.1 10.6 9.8 9.9 2 9.7 9.5 10.3 10.5 3 10.1 10.7 9.2 10 4 9.9 9.8 10.4 10.1 5 10.4 10.1 10.9 9.9 The control charts constant chart is given below: Sample Size Factor for (n) X-bar (A2) Factor for LCL for R (D3) Factor for UCL for R (D4) 3.267 2 1.88 0 3 1.023 0 2.574 N 4 0.729 O 2.282 5 0.577 0 2.114 6 0.483 0 2.004 7 0.419 0.076 1.924 8 0.373 0.136 1.864 9 0.337 0.184 1.816 The control charts constant chart is given below: Factor for Sample Size Factor for (n) X-bar (A2) LCL for R (D3) Factor for UCL for R (D4) 2 1.88 0 3.267 3 1.023 0 2.574 4 0.729 0 2.282 5 0.577 0 2.114 6 0.483 0 2.004 7 0.419 0.076 1.924 8 0.373 0.136 1.864 9 0.337 0.184 1.816 O 2.57 O 2.07 0.81 O 2.24
Step by Step Solution
There are 3 Steps involved in it
1 Expert Approved Answer
Step: 1 Unlock

Question Has Been Solved by an Expert!
Get step-by-step solutions from verified subject matter experts
Step: 2 Unlock
Step: 3 Unlock