

Question: Old MathJax webview it is not compulsory to answer all 7 sub parts but please answer atleast 4-5 which you can answer and i will
Old MathJax webview
it is not compulsory to answer all 7 sub parts but please answer atleast 4-5 which you can answer and i will upvote
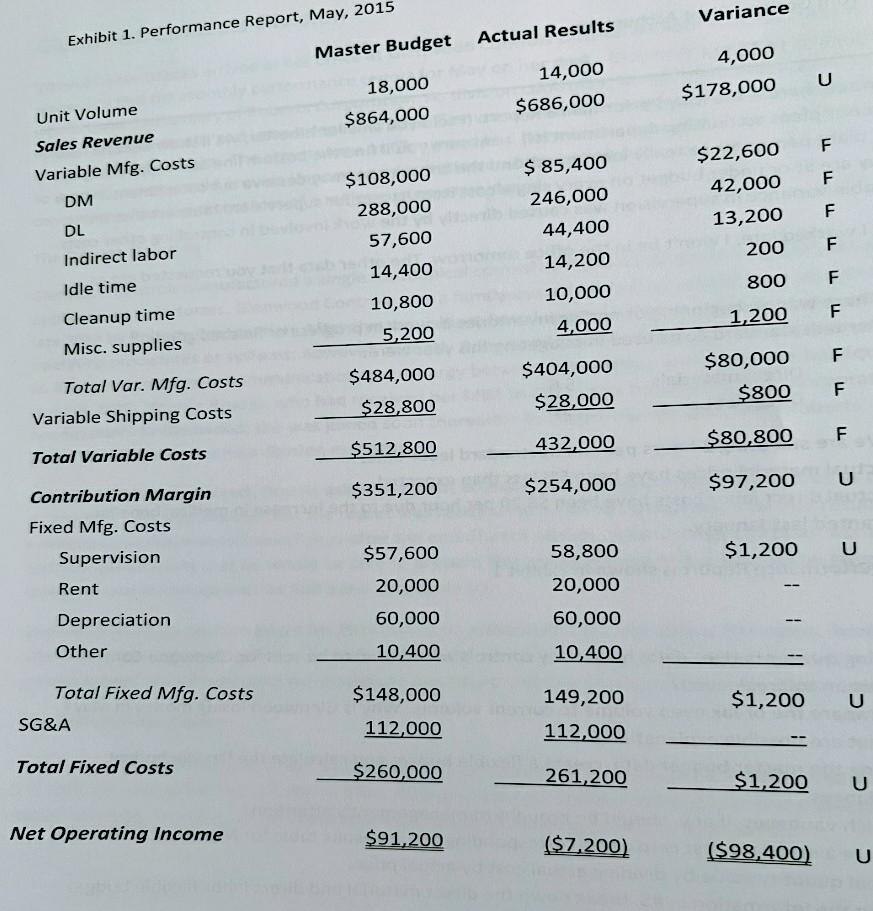
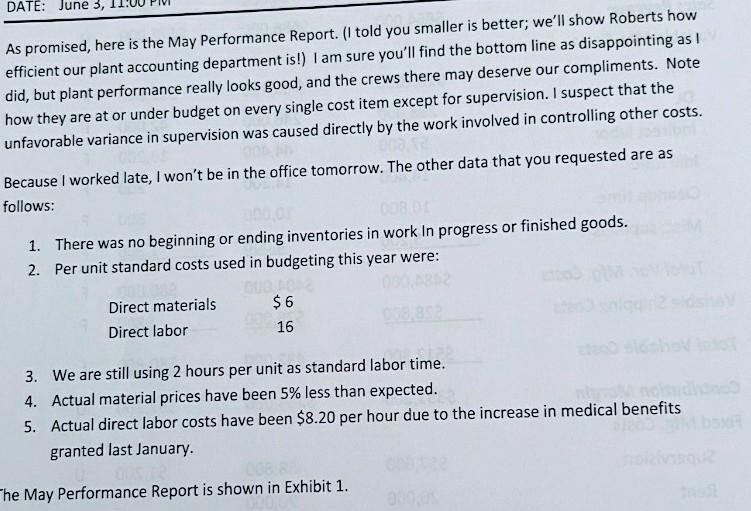
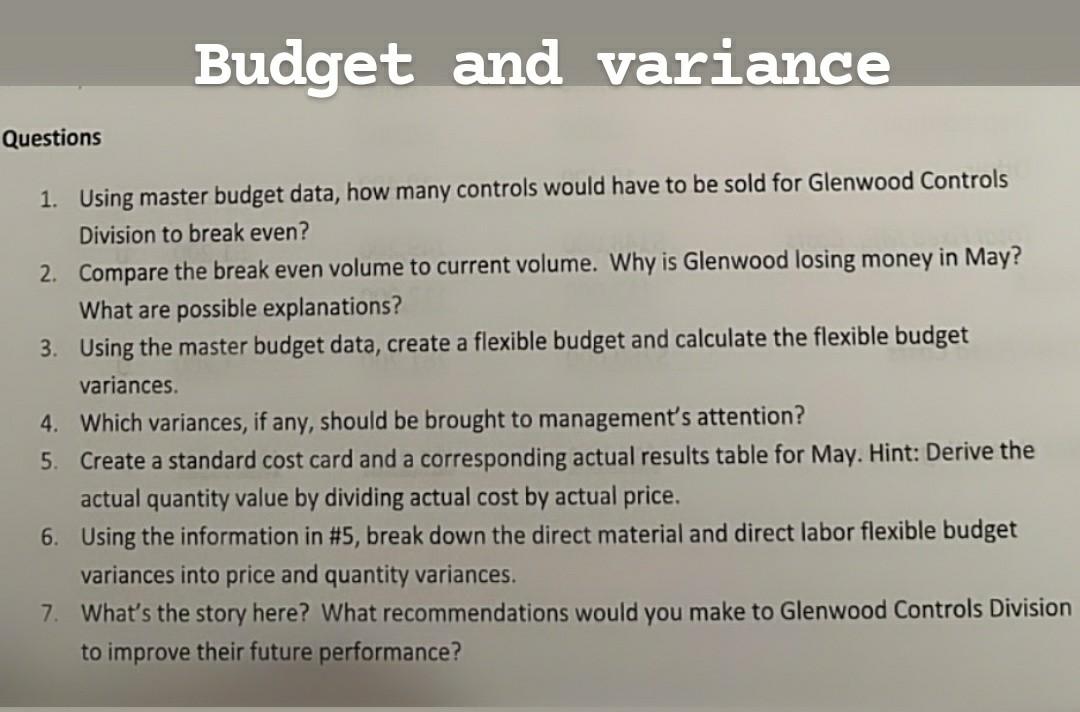
Variance Exhibit 1. Performance Report, May, 2015 Actual Results Master Budget 4,000 $178,000 U 14,000 $686,000 18,000 $864,000 Unit Volume Sales Revenue F F Variable Mfg. Costs DM $22,600 42,000 13,200 F DL $ 85,400 246,000 44,400 14,200 10,000 4,000 200 F $108,000 288,000 57,600 14,400 10,800 5,200 800 Indirect labor Idle time Cleanup time Misc. supplies F 1,200 F $484,000 Total Var. Mfg. Costs Variable Shipping Costs $404,000 $28,000 $80,000 F $800 F $28,800 F $80,800 432,000 $512,800 Total Variable Costs $254,000 $351,200 U $97,200 Contribution Margin Fixed Mfg. Costs Supervision 58,800 $1,200 U Rent 20,000 $57,600 20,000 60,000 10,400 60,000 Depreciation Other 10,400 149,200 Total Fixed Mfg. Costs SG&A $1,200 U $148,000 112,000 112,000 Total Fixed Costs $260,000 261,200 $1,200 U Net Operating Income $91,200 ($7,200) ($98,400) U DATE: June 3, As promised, here is the May Performance Report. (I told you smaller is better; we'll show Roberts how efficient our plant accounting department is!) I am sure you'll find the bottom line as disappointing as I did, but plant performance really looks good, and the crews there may deserve our compliments. Note how they are at or under budget on every single cost item except for supervision. I suspect that the unfavorable variance in supervision was caused directly by the work involved in controlling other costs. Because I worked late, I won't be in the office tomorrow. The other data that you requested are as follows: 1. There was no beginning or ending inventories in work in progress or finished goods. 2. Per unit standard costs used in budgeting this year were: $6 Direct materials Direct labor 16 3. We are still using 2 hours per unit as standard labor time. 4. Actual material prices have been 5% less than expected. 5. Actual direct labor costs have been $8.20 per hour due to the increase in medical benefits granted last January The May Performance Report is shown in Exhibit 1. Budget and variance Questions 1. Using master budget data, how many controls would have to be sold for Glenwood Controls Division to break even? 2. Compare the break even volume to current volume. Why is Glenwood losing money in May? What are possible explanations? 3. Using the master budget data, create a flexible budget and calculate the flexible budget variances. 4. Which variances, if any, should be brought to management's attention? 5. Create a standard cost card and a corresponding actual results table for May. Hint: Derive the actual quantity value by dividing actual cost by actual price. 6. Using the information in #5, break down the direct material and direct labor flexible budget variances into price and quantity variances. 7. What's the story here? What recommendations would you make to Glenwood Controls Division to improve their future performance? Variance Exhibit 1. Performance Report, May, 2015 Actual Results Master Budget 4,000 $178,000 U 14,000 $686,000 18,000 $864,000 Unit Volume Sales Revenue F F Variable Mfg. Costs DM $22,600 42,000 13,200 F DL $ 85,400 246,000 44,400 14,200 10,000 4,000 200 F $108,000 288,000 57,600 14,400 10,800 5,200 800 Indirect labor Idle time Cleanup time Misc. supplies F 1,200 F $484,000 Total Var. Mfg. Costs Variable Shipping Costs $404,000 $28,000 $80,000 F $800 F $28,800 F $80,800 432,000 $512,800 Total Variable Costs $254,000 $351,200 U $97,200 Contribution Margin Fixed Mfg. Costs Supervision 58,800 $1,200 U Rent 20,000 $57,600 20,000 60,000 10,400 60,000 Depreciation Other 10,400 149,200 Total Fixed Mfg. Costs SG&A $1,200 U $148,000 112,000 112,000 Total Fixed Costs $260,000 261,200 $1,200 U Net Operating Income $91,200 ($7,200) ($98,400) U DATE: June 3, As promised, here is the May Performance Report. (I told you smaller is better; we'll show Roberts how efficient our plant accounting department is!) I am sure you'll find the bottom line as disappointing as I did, but plant performance really looks good, and the crews there may deserve our compliments. Note how they are at or under budget on every single cost item except for supervision. I suspect that the unfavorable variance in supervision was caused directly by the work involved in controlling other costs. Because I worked late, I won't be in the office tomorrow. The other data that you requested are as follows: 1. There was no beginning or ending inventories in work in progress or finished goods. 2. Per unit standard costs used in budgeting this year were: $6 Direct materials Direct labor 16 3. We are still using 2 hours per unit as standard labor time. 4. Actual material prices have been 5% less than expected. 5. Actual direct labor costs have been $8.20 per hour due to the increase in medical benefits granted last January The May Performance Report is shown in Exhibit 1. Budget and variance Questions 1. Using master budget data, how many controls would have to be sold for Glenwood Controls Division to break even? 2. Compare the break even volume to current volume. Why is Glenwood losing money in May? What are possible explanations? 3. Using the master budget data, create a flexible budget and calculate the flexible budget variances. 4. Which variances, if any, should be brought to management's attention? 5. Create a standard cost card and a corresponding actual results table for May. Hint: Derive the actual quantity value by dividing actual cost by actual price. 6. Using the information in #5, break down the direct material and direct labor flexible budget variances into price and quantity variances. 7. What's the story here? What recommendations would you make to Glenwood Controls Division to improve their future performance
Step by Step Solution
There are 3 Steps involved in it

Get step-by-step solutions from verified subject matter experts