

Question: Old MathJax webview please show all the steps. and numbering (a) Use Microsoft Excel to compute the mean and range of each sample, calculate control
Old MathJax webview
please show all the steps. and numbering
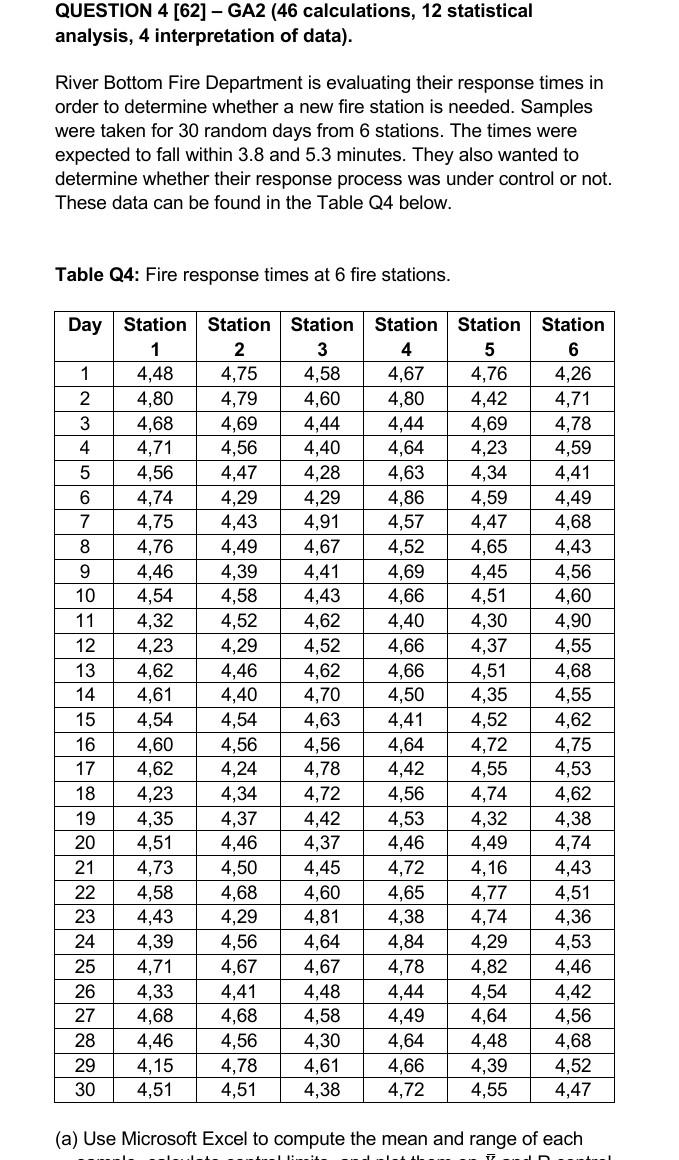
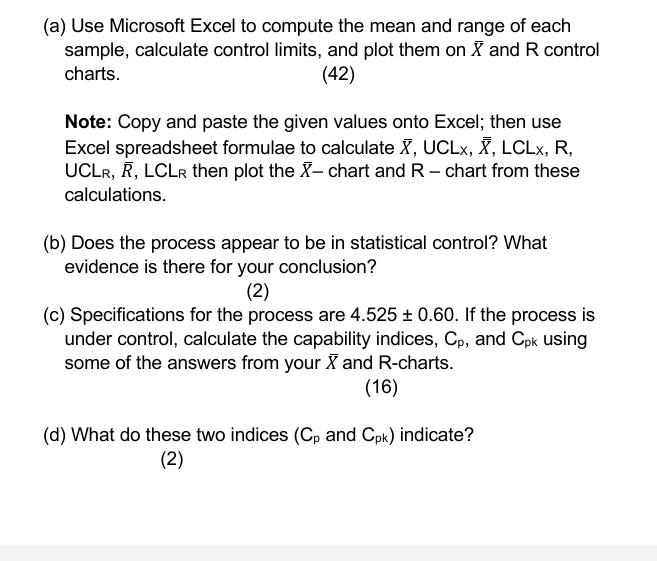
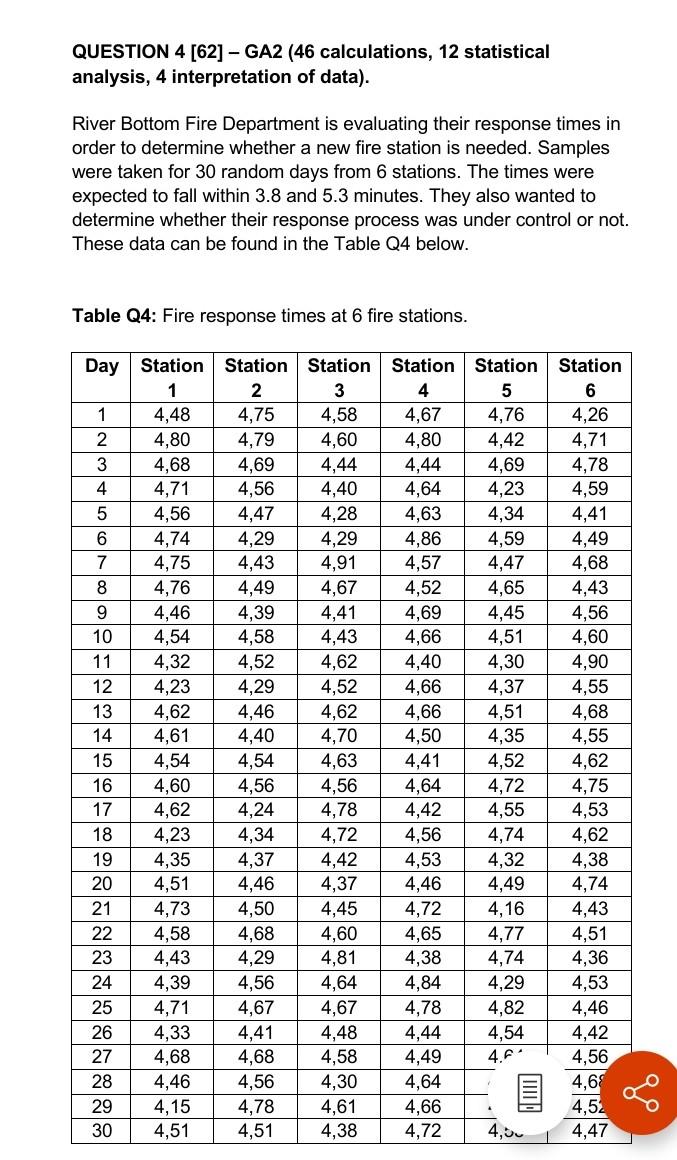
(a) Use Microsoft Excel to compute the mean and range of each sample, calculate control limits, and plot them on X and R control charts. (42) Note: Copy and paste the given values onto Excel; then use Excel spreadsheet formulae to calculate X, UCLx, , LCLx, R, UCLR, , LCLR then plot the X-chart and R - chart from these calculations. (b) Does the process appear to be in statistical control? What evidence is there for your conclusion? (2) (c) Specifications for the process are 4.525 + 0.60. If the process is under control, calculate the capability indices, Cp, and Cpk using some of the answers from your X and R-charts. (16) (d) What do these two indices (Cp and Cpk) indicate? (2) QUESTION 4 [62] - GA2 (46 calculations, 12 statistical analysis, 4 interpretation of data). River Bottom Fire Department is evaluating their response times in order to determine whether a new fire station is needed. Samples were taken for 30 random days from 6 stations. The times were expected to fall within 3.8 and 5.3 minutes. They also wanted to determine whether their response process was under control or not. These data can be found in the Table Q4 below. Table Q4: Fire response times at 6 fire stations. 56 Station 5 4,76 4,42 4,69 4,23 4,34 4,59 4,47 4,65 4,45 LO CON Day Station Station 1 2 1 4,48 4,75 2 4,80 4,79 3 4,68 4,69 4 4,71 4,56 4,56 4,47 4,74 4,29 4,75 4,43 4,76 4,49 9 4,46 4,39 10 4,54 4,58 11 4,32 4,52 12 4,23 4,29 13 4,62 4,46 14 4,61 4,40 15 4,54 4,54 16 4,60 4,56 17 4,62 4,24 18 4,23 4,34 19 4,35 4,37 20 4,51 4,46 21 4,73 4,50 22 4,58 4,68 23 4,43 4,29 24 4,39 4,56 25 4,71 4,67 26 4,33 4,41 27 4,68 4,68 28 4,46 4,56 29 4,15 4,78 30 4,51 4,51 4,51 Station 3 4,58 4,60 4,44 4,40 4,28 4,29 4,91 4,67 4,41 4,43 4,62 4,52 4,62 4,70 4,63 4,56 4,78 4,72 4,42 4,37 4,45 4,60 4,81 4,64 4,67 4,48 4,58 4,30 4,61 4,38 Station 4 4,67 4,80 4,44 4,64 4,63 4,86 4,57 4,52 4,69 4,66 4,40 4,66 4,66 4,50 4,41 4,64 4,42 4,56 4,53 4,46 4,72 4,65 4,38 4,84 4,78 4,44 4,49 4,64 4,66 4,72 Station 6 4,26 4,71 4,78 4,59 4,41 4,49 4,68 4,43 4,56 4,60 4,90 4,55 4,68 4,55 4,62 4,75 4,53 4,62 4,30 4,37 4,51 4,35 4,52 4,72 4,55 4,74 4,32 4,49 4,16 4,77 4,74 4,29 4,82 4,54 4.F' 4,38 UTIT 4,74 4,43 4,51 4,36 4,53 4,46 4,42 4,56 4,68 4,52 4,47 . 4,0 QUESTION 4 [62] - GA2 (46 calculations, 12 statistical analysis, 4 interpretation of data). River Bottom Fire Department is evaluating their response times in order to determine whether a new fire station is needed. Samples were taken for 30 random days from 6 stations. The times were expected to fall within 3.8 and 5.3 minutes. They also wanted to determine whether their response process was under control or not. These data can be found in the Table Q4 below. Table Q4: Fire response times at 6 fire stations. 4,40 Day Station Station Station Station 1 2 3 4 1 4,48 4,75 4,58 4,67 2 4,80 4,79 4,60 4,80 3 4,68 4,69 4,44 4,44 4 4,71 4,56 4,64 5 4,56 4,47 4,28 4,63 6 4,74 4,29 4,29 4,86 7 4,75 4,43 4,91 4,57 8 4,76 4,49 4,67 4,52 9 4,46 4,39 4,41 4,69 10 4,54 4,58 4,43 4,66 11 4,32 4,52 4,62 4,40 12 4,23 4,29 4,52 4,66 13 4,62 4,46 4,62 4,66 14 4,61 4,40 4,70 4,50 15 4,54 4,54 4,63 4,41 16 4,60 4,56 4,56 4,64 17 4,62 4,24 4,78 4,42 18 4,23 4,34 4,72 4,56 19 4,35 4,37 4,42 4,53 20 4,51 4,46 4,37 4,46 21 4,73 4,50 4,45 4,72 22 4,58 4,68 4,60 4,65 23 4,43 4,29 4,81 4,38 24 4,39 4,56 4,64 4,84 25 4,71 4,67 4,67 4,78 26 4,33 4,41 4,48 4,44 27 4,68 4,68 4,49 28 4,46 4,56 4,30 4,64 29 4,15 4,78 4,61 4,66 30 4,51 4,51 4,38 4,72 Station 5 4,76 4,42 4,69 4,23 4,34 4,59 4,47 4,65 4,45 4,51 4,30 4,37 4,51 4,35 4,52 4,72 4,55 4,74 4,32 4,49 4,16 4,77 4,74 4,29 4,82 4,54 4,64 4,48 4,39 4,55 Station 6 4,26 4,71 4,78 4,59 4,41 4,49 4,68 4,43 4,56 4,60 4,90 4,55 4,68 4,55 4,62 4,75 4,53 4,62 4,38 4,74 4,43 4,51 4,36 4,53 4,46 4,42 4,56 4,68 4,52 4,47 4,58 H | (a) Use Microsoft Excel to compute the mean and range of each
Step by Step Solution
There are 3 Steps involved in it
1 Expert Approved Answer
Step: 1 Unlock

Question Has Been Solved by an Expert!
Get step-by-step solutions from verified subject matter experts
Step: 2 Unlock
Step: 3 Unlock