

Question: Old MathJax webview please show what you typed in each cell to get the answer, thank you Growth us 2% Cost of capital is 9.38%
Old MathJax webview
please show what you typed in each cell to get the answer, thank you
Growth us 2% Cost of capital is 9.38%
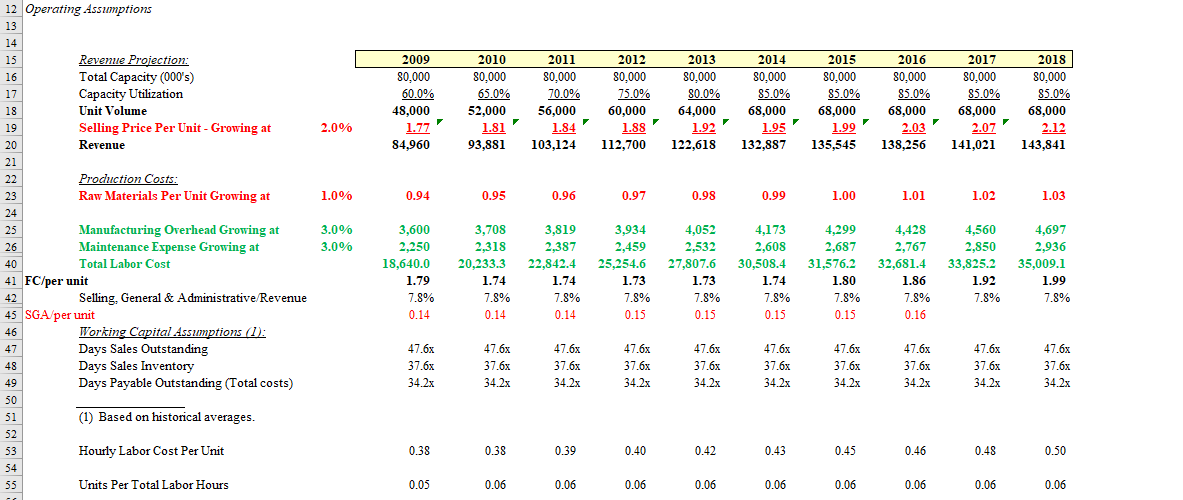
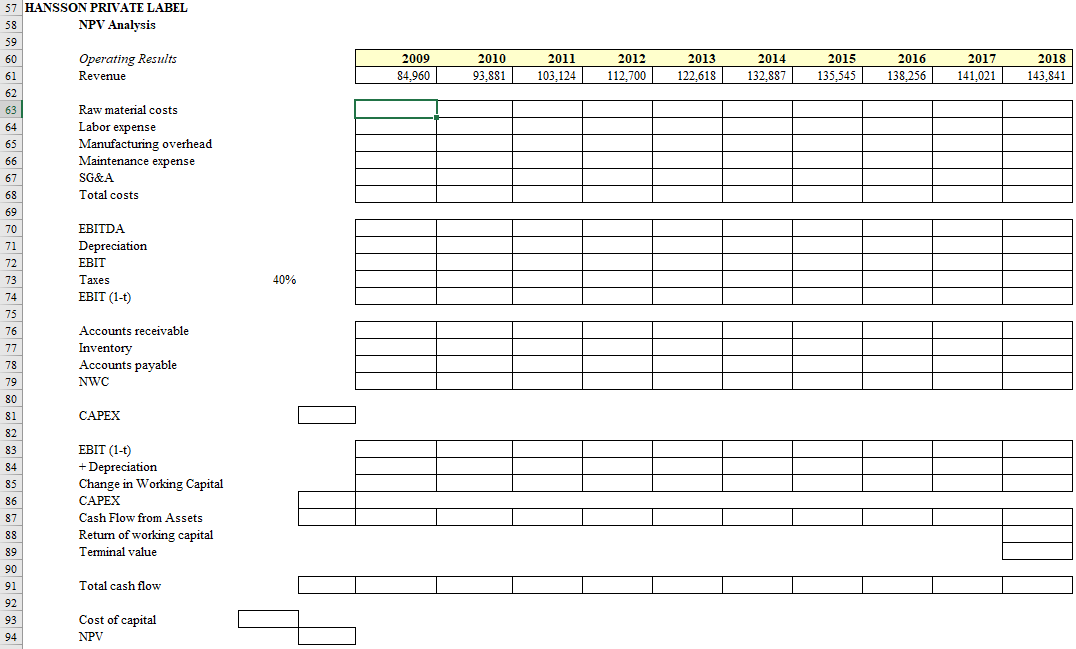
2009 80,000 60.0% 48,000 1.77 84,960 2010 80,000 65.0% 52.000 1.81 93,881 2011 80,000 70.0% 56,000 1.84 103,124 2012 80,000 75.0% 60,000 1.88 112,700 2013 80,000 80.0% 64.000 1.92 122,618 2014 80.000 85.0% 68.000 2015 80,000 85.0% 68,000 1.99 135,545 2016 80,000 85.0% 68,000 2.03 138,256 2017 80,000 85.0% 68,000 2.07 141,021 2018 80,000 85.0% 68,000 2.12 143,841 2.0% 1.95 132,887 1.0% 0.94 0.95 0.96 0.97 0.98 0.99 1.00 1.01 1.02 1.03 12 Operating Assumptions 13 14 15 Revenue Projection: 16 Total Capacity (000's) 17 Capacity Utilization 18 Unit Volume 19 Selling Price Per Unit - Growing at 20 Revenue 21 22 Production Costs: 23 Raw Materials Per Unit Growing at 24 25 Manufacturing Overhead Growing at 26 Maintenance Expense Growing at 40 Total Labor Cost 41 FC/per unit 42 Selling, General & Administrative/Revenue 45 SGA/per unit 46 Working Capital Assumptions (1): Days Sales Outstanding 48 Days Sales Inventory 49 Days Payable Outstanding (Total costs) 50 51 (1) Based on historical averages. 52 53 Hourly Labor Cost Per Unit 54 55 Units Per Total Labor Hours 3.0% 3.0% 3,600 2.250 18.640.0 1.79 7.8% 0.14 3,708 2,318 20.233.3 1.74 7.8% 0.14 3,819 2,387 22,842.4 1.74 7.8% 0.14 3,934 2,459 25.254.6 1.73 7.8% 0.15 4,052 2,532 27.807.6 1.73 7.8% 0.15 4,173 2,608 30.508.4 1.74 7.8% 0.15 4,299 2,687 31,576.2 1.80 7.8% 0.15 # 4,428 2,767 32,681.4 1.86 7.8% 0.16 4,560 2,850 33,825.2 1.92 7.8% 4,697 2,936 35.009.1 1.99 7.8% 47 47.6x 37.6x 34 2x 47.6x 37,6x 34 2x 47.6% 37.6x 34 2x 47. 5 37.6x 34.2x 47.6x 37.6x 34.2x 47.6% 37.6x 34 2x 47.6x 37.6x 34.2x 47.6x 37.6x 34 2x 47.6% 37.6x 34 2x 47.6x 37.6x 34.2x 0.38 0.38 0.39 0.40 0.42 0.43 0.45 0.46 0.48 0.50 0.05 0.06 0.06 0.06 0.06 0.06 0.06 0.06 0.06 0.06 2009 84.960 2010 93,881 2011 103.124 2012 112,700 2013 122.618 2014 132,887 2015 135,545 2016 138,256 2017 141,021 2018 143,841 40% 57 HANSSON PRIVATE LABEL 58 NPV Analysis 59 60 Operating Results 61 Revenue 62 63 Raw material costs 64 Labor expense 65 Manufacturing overhead 66 Maintenance expense 67 SG&A 68 Total costs 69 70 EBITDA 71 Depreciation 72 EBIT 73 Taxes 74 EBIT (1-t) 75 76 Accounts receivable 77 Inventory 78 Accounts payable 79 NWC 80 81 CAPEX 82 83 EBIT (1-t) 84 + Depreciation 85 Change in Working Capital 86 CAPEX 87 Cash Flow from Assets 88 Return of working capital 89 Terminal value 90 91 Total cash flow 92 93 Cost of capital 94 NPV 2009 80,000 60.0% 48,000 1.77 84,960 2010 80,000 65.0% 52.000 1.81 93,881 2011 80,000 70.0% 56,000 1.84 103,124 2012 80,000 75.0% 60,000 1.88 112,700 2013 80,000 80.0% 64.000 1.92 122,618 2014 80.000 85.0% 68.000 2015 80,000 85.0% 68,000 1.99 135,545 2016 80,000 85.0% 68,000 2.03 138,256 2017 80,000 85.0% 68,000 2.07 141,021 2018 80,000 85.0% 68,000 2.12 143,841 2.0% 1.95 132,887 1.0% 0.94 0.95 0.96 0.97 0.98 0.99 1.00 1.01 1.02 1.03 12 Operating Assumptions 13 14 15 Revenue Projection: 16 Total Capacity (000's) 17 Capacity Utilization 18 Unit Volume 19 Selling Price Per Unit - Growing at 20 Revenue 21 22 Production Costs: 23 Raw Materials Per Unit Growing at 24 25 Manufacturing Overhead Growing at 26 Maintenance Expense Growing at 40 Total Labor Cost 41 FC/per unit 42 Selling, General & Administrative/Revenue 45 SGA/per unit 46 Working Capital Assumptions (1): Days Sales Outstanding 48 Days Sales Inventory 49 Days Payable Outstanding (Total costs) 50 51 (1) Based on historical averages. 52 53 Hourly Labor Cost Per Unit 54 55 Units Per Total Labor Hours 3.0% 3.0% 3,600 2.250 18.640.0 1.79 7.8% 0.14 3,708 2,318 20.233.3 1.74 7.8% 0.14 3,819 2,387 22,842.4 1.74 7.8% 0.14 3,934 2,459 25.254.6 1.73 7.8% 0.15 4,052 2,532 27.807.6 1.73 7.8% 0.15 4,173 2,608 30.508.4 1.74 7.8% 0.15 4,299 2,687 31,576.2 1.80 7.8% 0.15 # 4,428 2,767 32,681.4 1.86 7.8% 0.16 4,560 2,850 33,825.2 1.92 7.8% 4,697 2,936 35.009.1 1.99 7.8% 47 47.6x 37.6x 34 2x 47.6x 37,6x 34 2x 47.6% 37.6x 34 2x 47. 5 37.6x 34.2x 47.6x 37.6x 34.2x 47.6% 37.6x 34 2x 47.6x 37.6x 34.2x 47.6x 37.6x 34 2x 47.6% 37.6x 34 2x 47.6x 37.6x 34.2x 0.38 0.38 0.39 0.40 0.42 0.43 0.45 0.46 0.48 0.50 0.05 0.06 0.06 0.06 0.06 0.06 0.06 0.06 0.06 0.06 2009 84.960 2010 93,881 2011 103.124 2012 112,700 2013 122.618 2014 132,887 2015 135,545 2016 138,256 2017 141,021 2018 143,841 40% 57 HANSSON PRIVATE LABEL 58 NPV Analysis 59 60 Operating Results 61 Revenue 62 63 Raw material costs 64 Labor expense 65 Manufacturing overhead 66 Maintenance expense 67 SG&A 68 Total costs 69 70 EBITDA 71 Depreciation 72 EBIT 73 Taxes 74 EBIT (1-t) 75 76 Accounts receivable 77 Inventory 78 Accounts payable 79 NWC 80 81 CAPEX 82 83 EBIT (1-t) 84 + Depreciation 85 Change in Working Capital 86 CAPEX 87 Cash Flow from Assets 88 Return of working capital 89 Terminal value 90 91 Total cash flow 92 93 Cost of capital 94 NPV
Step by Step Solution
There are 3 Steps involved in it

Get step-by-step solutions from verified subject matter experts