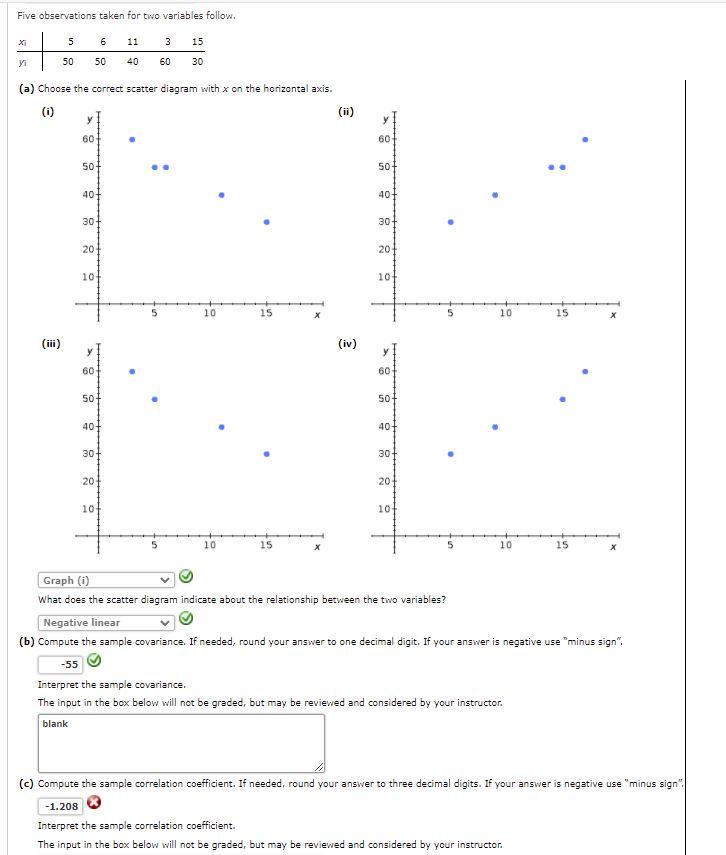
Question: ONLY NEED ANSWER 3 Five observations taken for two variables follow. X1 56 5 11 3 15 yi 50 50 40 60 30 (a) Choose

ONLY NEED ANSWER 3

ONLY NEED ANSWER 3 Five observations taken for

Five observations taken for two variables follow. X1 56 5 11 3 15 yi 50 50 40 60 30 (a) Choose the correct scatter diagram with x on the horizontal axis. (0) (ii) y 60 60 50+ 50 40 40 30 30 20 20 10 10 10 15 5 10 15 ( (iii) (iv) y y 60 60 50+ 50 40 40 30+ 30 201 20 101 10 10 15 10 15 Graph (1) What does the scatter diagram indicate about the relationship between the two variables? Negative linear (b) Compute the sample covariance. If needed, round your answer to one decimal digit. If your answer is negative use "minus sign". -55 Interpret the sample covariance. The input in the box below will not be graded, but may be reviewed and considered by your instructor. blank (c) Compute the sample correlation coefficient. If needed, round your answer to three decimal digits. If your answer is negative use "minus sign". - 1.208 Interpret the sample correlation coefficient. The input in the box below will not be graded, but may be reviewed and considered by your instructor

Step by Step Solution

There are 3 Steps involved in it

1 Expert Approved Answer
Step: 1 Unlock blur-text-image
Question Has Been Solved by an Expert!

Get step-by-step solutions from verified subject matter experts

Step: 2 Unlock
Step: 3 Unlock

Students Have Also Explored These Related General Management Questions!