

Question: Open recovered workbooks? Your recent changes were saved. Do you want to continue working wh Required information [ The following information applies to the questions
Open recovered workbooks? Your recent changes were saved. Do you want to continue working wh
Required information
The following information applies to the questions displayed below.
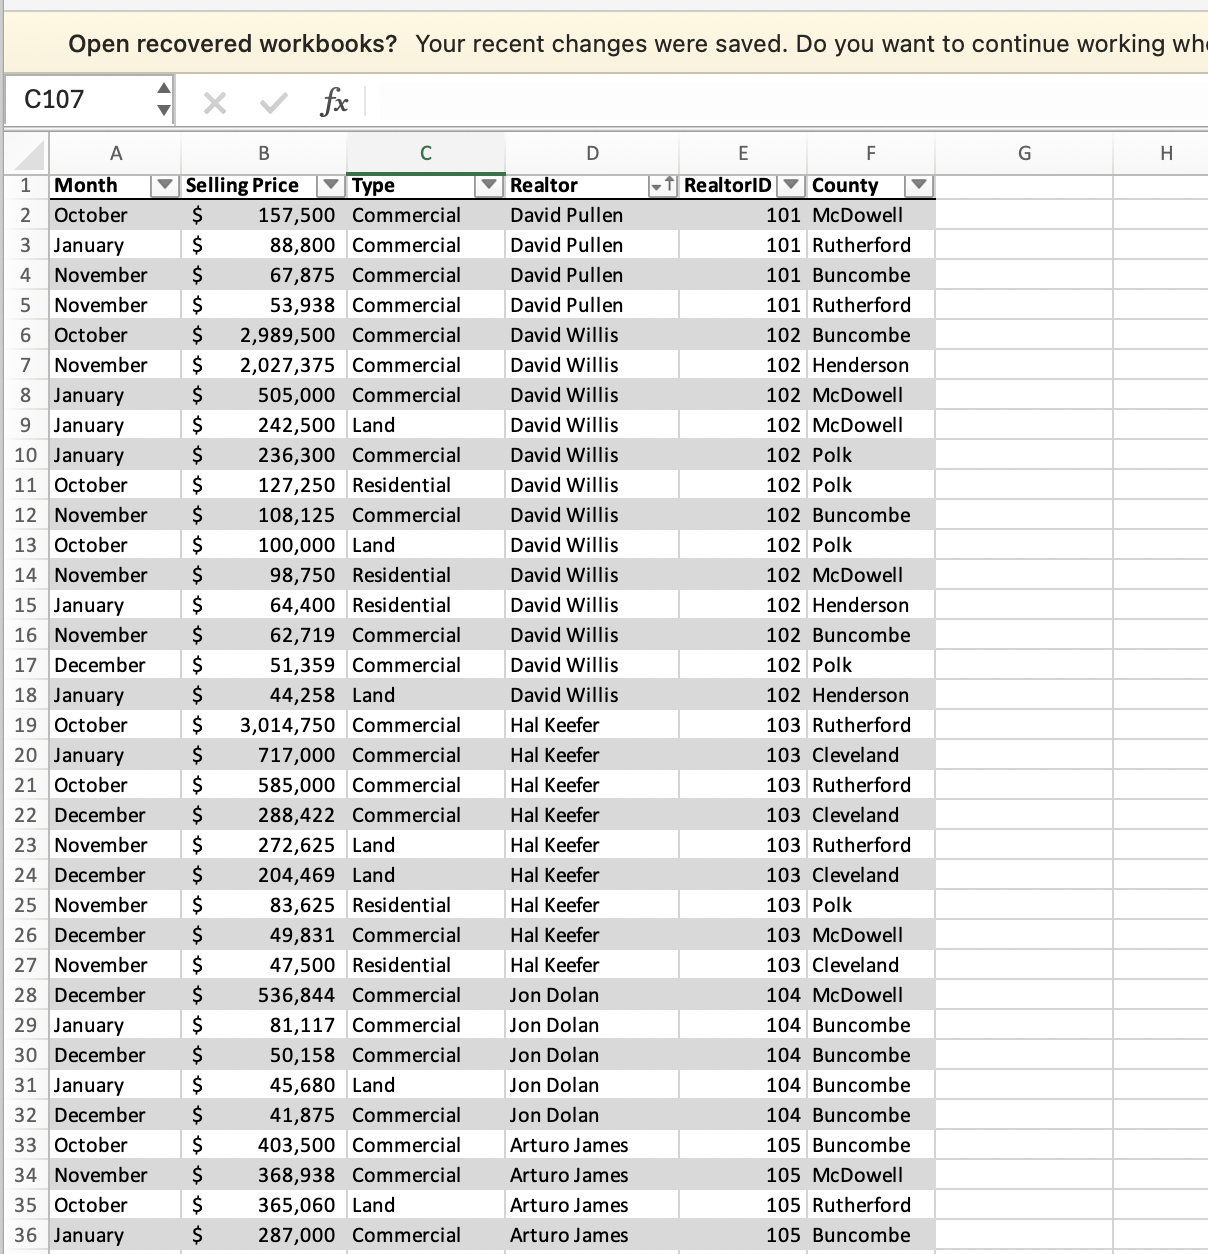
Chapman Realty Company is seeking your help in analyzing its sales across counties and property types over the last four months. During this time period the company's realtors sold properties residential commercial, and land across six counties for a total of $
Click here to download the Excel template, which you will use to answer the questions that follow. Rename the file with your first and last name as you will need to upload the file at the completion of this assignment.
Click here for a brief tutorial on PivotTables in Excel.
Click here for a brief tutorial on PivotCharts in Excel.
Add a new sheet in the excel template titled "Question
a Create a PivotTable to summarize and then calculate the cumulative sales for each county during the fourmonth period.
b Using PivotChart, create a bar chart that shows each county's cumulative sales during the fourmonth period.
Which counties had the third and fifth highest sales? How much did each of them sell during the fourmonth period?
Add a new sheet in the excel template titled "Question
a Create a PivotTable to summarize and then calculate the cumulative sales for each county by property type during the fourmonth period.
b Using PivotChart, create a bar chart that shows each county's cumulative sales of each property type during the fourmonth period.
Which county had the highest sales within each property type? In each case, how much was sold by the county?
Add a new sheet in the excel template titled "Question
a Create a PivotTable to summarize and then calculate the cumulative number of sales transactions for each county during the fourmonth period.
b Using PivotChart, create a bar chart that shows each county's cumulative number of sales transactions during the fourmonth period.
Which three counties had the highest number of sales transactions? How many sales transactions were completed in each of those counties? Add a new sheet in the excel template titled "Question
a Create a PivotTable to summarize and then calculate the cumulative sales for each property type during the fourmonth period.
b Using PivotChart, create a bar chart that shows each property type's cumulative sales during the fourmonth period.
Which property type had the lowest sales total, and what was that amount?
Property type that had the lowest sales
The following information applies to the questions displayed below.
Chapman Realty Company is seeking your help in analyzing its sales across counties and property types over the last four months. During this time period the company's realtors sold properties residential commercial, and land across six counties for a total of $
Click here to download the Excel template. which you will use to answer the questions that follow, Rename the file with your first and last name as you will need to upload the file at the completion of this assignment.
Click here for a brief tutorial on PivotTables in Excel.
Click here for a brief tutorial on PivotCharts in Excel.
Add a new sheet in the excel template titled "Question
a Create a PivotTable to summarize and then calculate the cumulative number of sales transactions for each property type during the fourmonth period.
b Using PivotChart, create a bar chart that shows each property type's cumulative number of sales transactions during the fourmonth period.
Now save your completed worksheet on to your computer and then upload it here by clicking "Browse." Next, click "Save."
upload a response file MB max
Choose File No file chosen
Which property type had the second highest number of sales transactions? How many transactions were completed?
Property type that had the second highest
Commercial
Sold
Step by Step Solution
There are 3 Steps involved in it
1 Expert Approved Answer
Step: 1 Unlock

Question Has Been Solved by an Expert!
Get step-by-step solutions from verified subject matter experts
Step: 2 Unlock
Step: 3 Unlock