

Question: please explain how to formulate r chart, the equation behind it A machine at the Pacific Fruit Company fills boxes with raisins. The labeled weight
please explain how to formulate r chart, the equation behind it
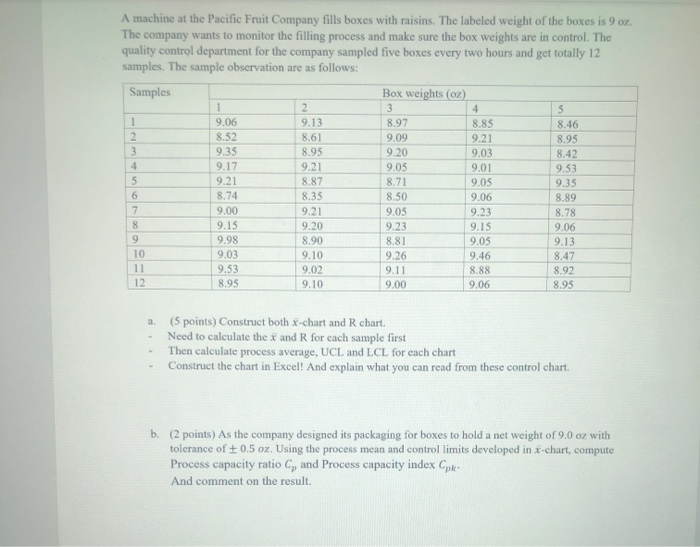
A machine at the Pacific Fruit Company fills boxes with raisins. The labeled weight of the boxes is 9 02. The company wants to monitor the filling process and make sure the box weights are in control. The quality control department for the company sampled five boxes every two hours and get totally 12 samples. The sample observation are as follows: Samples Box weights (oz) 1 2 3 4 5 1 9.06 9.13 8.97 8.85 8.46 2 8.52 8.61 9.09 9.21 8.95 3 9.35 8.95 9.20 9.03 8.42 4 9.17 9.21 9.05 9.01 9.53 5 8.87 8.71 9.05 9.35 6 8.74 8.35 8.50 9.06 8.89 7 9.00 9.21 9.05 9.23 8.78 8 9.15 9.20 9.23 9.15 9.06 9.98 8.90 8.81 9.03 9.13 10 9.03 9.10 9.26 9.46 8,47 9.53 9.02 9.11 8.88 8.92 12 8.95 9.10 9.00 9.06 8.95 9.21 9 a (5 points) Construct both X-chart and R chart. Need to calculate the x and R for each sample first Then calculate process average, UCL and LCL for each chart Construct the chart in Excel! And explain what you can read from these control chart. b. (2 points) As the company designed its packaging for boxes to hold a net weight of 9.0 oz with tolerance of +0.5 oz. Using the process mean and control limits developed in x-chart, compute Process capacity ratio C, and Process capacity index Cpk- And comment on the result Step by Step Solution
There are 3 Steps involved in it
1 Expert Approved Answer
Step: 1 Unlock

Question Has Been Solved by an Expert!
Get step-by-step solutions from verified subject matter experts
Step: 2 Unlock
Step: 3 Unlock