

Question: Instructions This is an individual assignment Use Microsoft Excel to build the control charts and answer any related questions and then upload a copy on
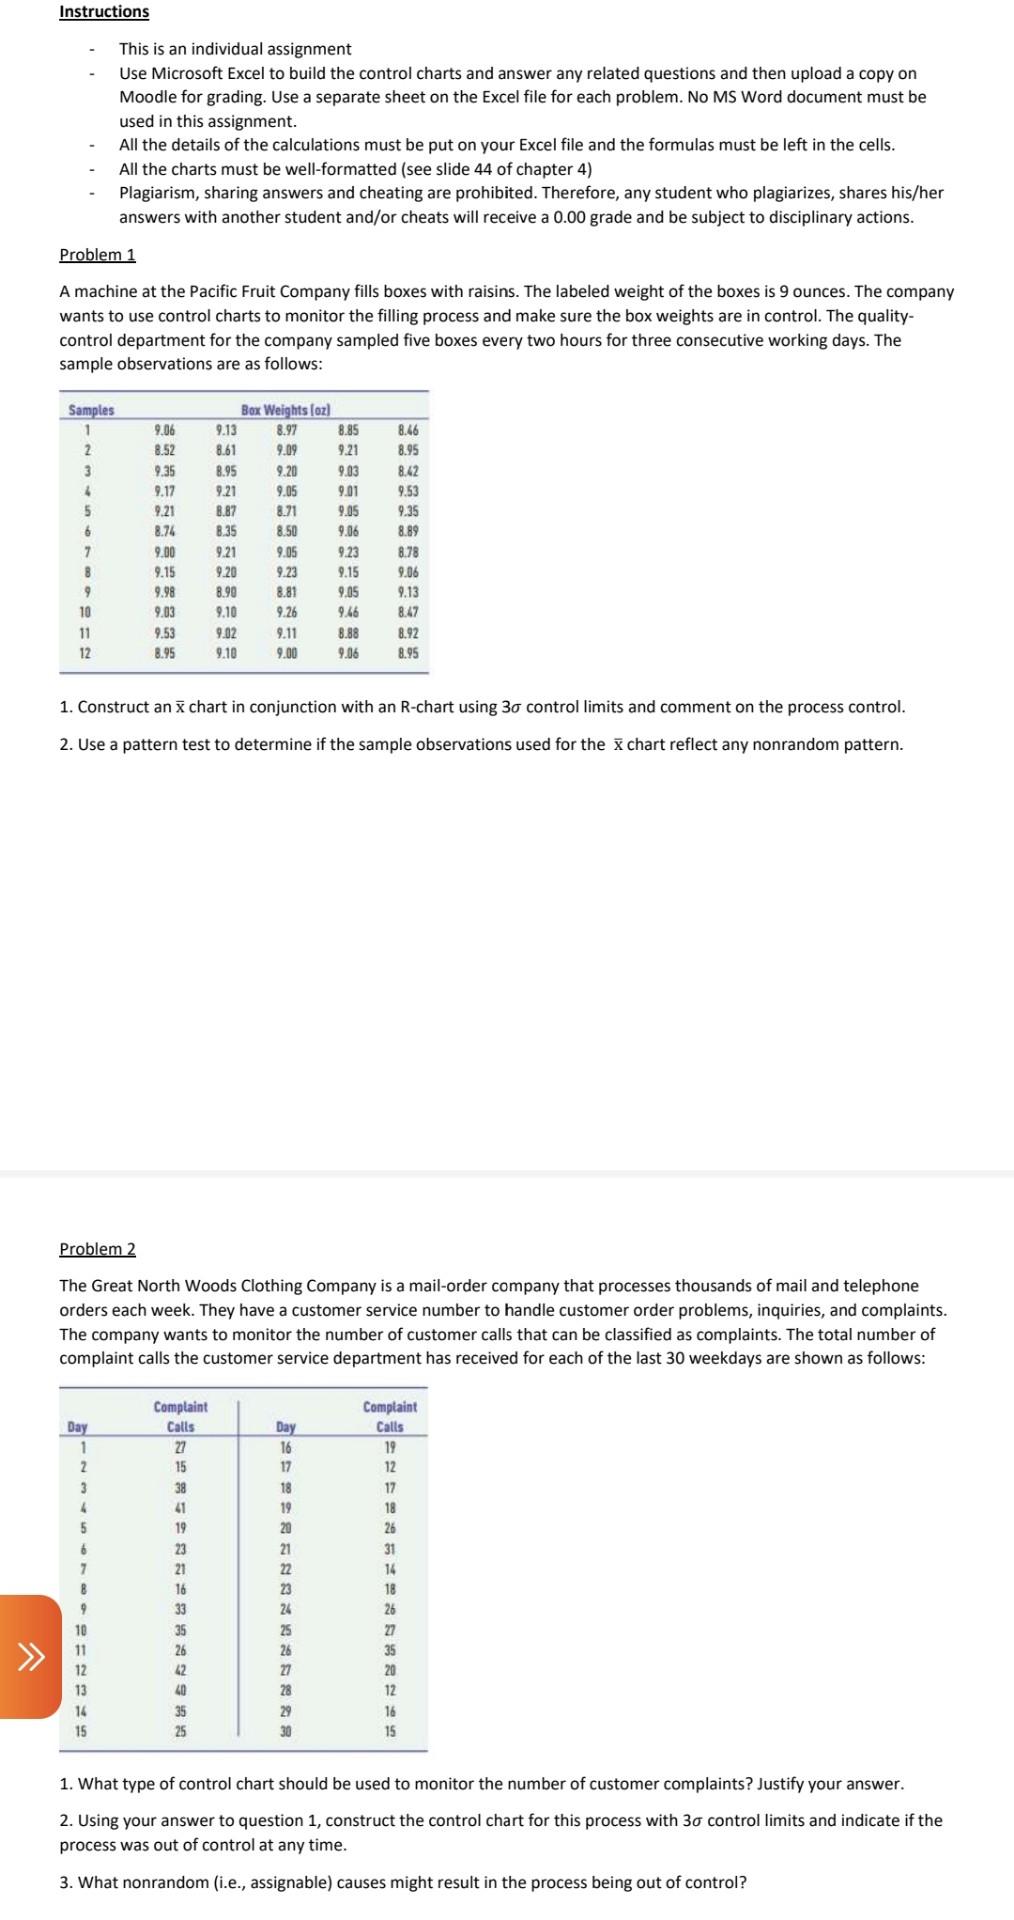
Instructions This is an individual assignment Use Microsoft Excel to build the control charts and answer any related questions and then upload a copy on Moodle for grading. Use a separate sheet on the Excel file for each problem. No MS Word document must be used in this assignment. All the details of the calculations must be put on your Excel file and the formulas must be left in the cells. All the charts must be well-formatted (see slide 44 of chapter 4) Plagiarism, sharing answers and cheating are prohibited. Therefore, any student who plagiarizes, shares his/her answers with another student and/or cheats will receive a 0.00 grade and be subject to disciplinary actions. Problem 1 A machine at the Pacific Fruit Company fills boxes with raisins. The labeled weight of the boxes is 9 ounces. The company wants to use control charts to monitor the filling process and make sure the box weights are in control. The quality- control department for the company sampled five boxes every two hours for three consecutive working days. The sample observations are as follows: Samples 1 2 3 4 5 6 7 8 9 10 11 12 9.06 8.52 9.35 9.17 9.21 8.74 9.00 9.15 9.98 9.03 9.53 8.95 Box Weights (oz) 9.13 8.92 8.85 8.61 9.09 9.21 8.95 9.20 9.83 9.21 9.05 9.01 8.87 8.71 9.05 8.35 8.50 9.06 9.21 9.05 9.23 9.20 9.23 9.15 8.90 8.81 9.05 9.10 9.26 9.46 9.02 9.11 8.88 9.10 9.00 9.06 8.46 8.95 8.42 9.53 9.35 8.89 8.78 9.06 9.13 8.47 8.92 8.95 1. Construct an chart in conjunction with an R-chart using 30 control limits and comment on the process control. 2. Use a pattern test to determine if the sample observations used for the x chart reflect any nonrandom pattern. Problem 2 The Great North Woods Clothing mpany is a mail-order company that processes thousands of mail and teleph orders each week. They have a customer service number to handle customer order problems, inquiries, and complaints. The company wants to monitor the number of customer calls that can be classified as complaints. The total number of complaint calls the customer service department has received for each of the last 30 weekdays are shown as follows: Day 1 2 3 4 Complaint Calls 27 15 38 41 19 23 21 16 33 Day 16 17 18 19 20 21 22 23 24 25 26 27 28 7 Complaint Calls 19 12 17 18 26 31 14 18 26 27 35 20 12 16 15 35 26 42 11 12 13 14 15 40 35 25 29 30 1. What type of control chart should be used to monitor the number of customer complaints? Justify your answer. 2. Using your answer to question 1, construct the control chart for this process with 30 control limits and indicate if the process was out of control at any time. 3. What nonrandom (i.e., assignable) causes might result in the process being out of control
Step by Step Solution
There are 3 Steps involved in it
1 Expert Approved Answer
Step: 1 Unlock

Question Has Been Solved by an Expert!
Get step-by-step solutions from verified subject matter experts
Step: 2 Unlock
Step: 3 Unlock