

Question: P & B Manufacturing For Year Ended December 31 Comparative Balance Sheet (dollars in millions) (dollars in millions) Ending Balance Beginning Balance Sales 4,450 Assets
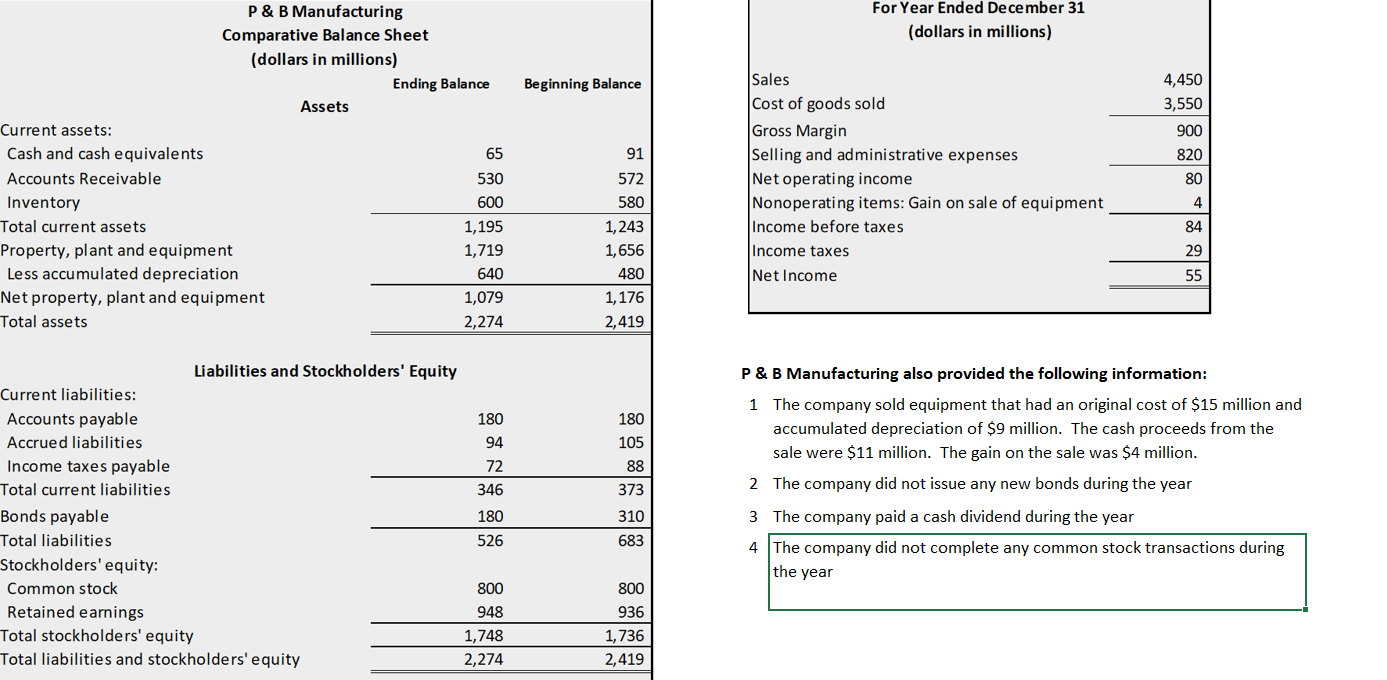
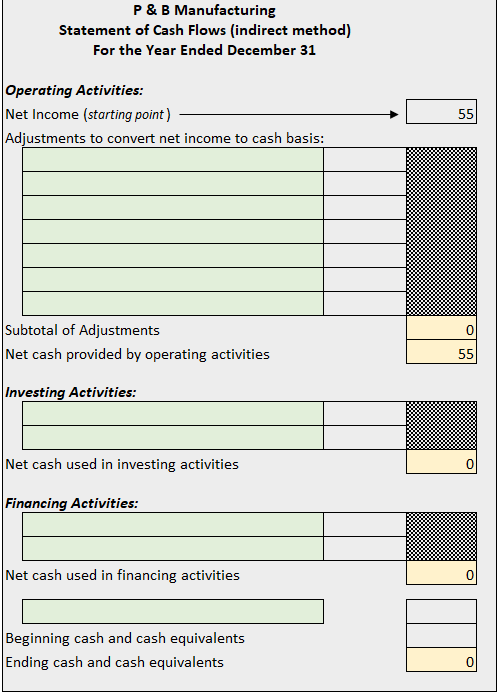
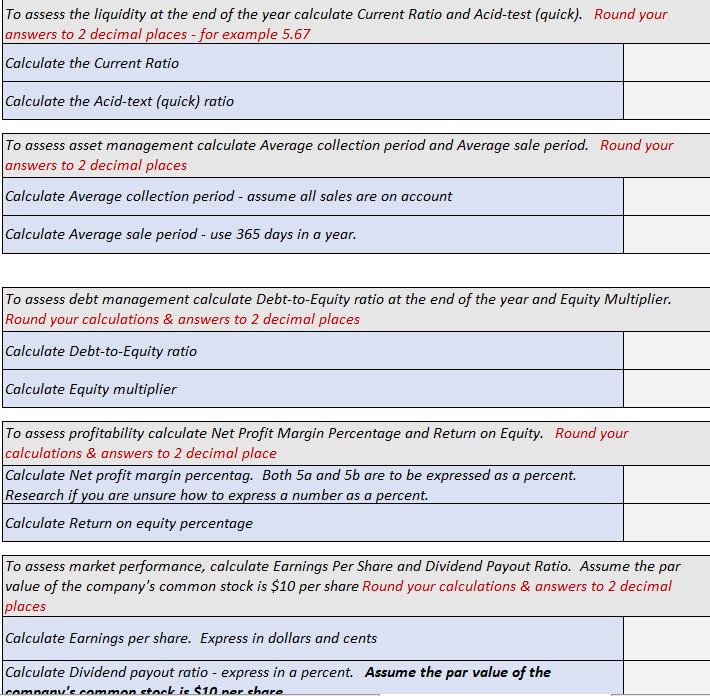
P & B Manufacturing For Year Ended December 31 Comparative Balance Sheet (dollars in millions) (dollars in millions) Ending Balance Beginning Balance Sales 4,450 Assets Cost of goods sold 3,550 Current assets: Gross Margin 900 Cash and cash equivalents 65 91 Selling and administrative expenses 820 Accounts Receivable 530 572 Net operating income 80 Inventory 600 580 Nonoperating items: Gain on sale of equipment 4 Total current assets 1,195 1,243 Income before taxes 84 Property, plant and equipment 1,719 1, 656 Income taxes 29 Less accumulated depreciation 540 480 Net Income 55 Net property, plant and equipment 1,079 1, 176 Total assets 2,274 2,419 Liabilities and Stockholders' Equity P & B Manufacturing also provided the following information: Current liabilities: 1 The company sold equipment that had an original cost of $15 million and Accounts payable 180 180 accumulated depreciation of $9 million. The cash proceeds from the Accrued liabilities 94 105 Income taxes payable 72 sale were $11 million. The gain on the sale was $4 million. 88 Total current liabilities 346 373 2 The company did not issue any new bonds during the year Bonds payable 180 310 3 The company paid a cash dividend during the year Total liabilities 526 683 4 The company did not complete any common stock transactions during Stockholders' equity: the year Common stock 800 800 Retained earnings 948 936 Total stockholders' equity 1,748 1, 736 Total liabilities and stockholders' equity 2,274 2,419P & B Manufacturing Statement of Cash Flows (indirect method) For the Year Ended December 31 Operating Activities: Net Income (starting point ) 55 Adjustments to convert net income to cash basis: Subtotal of Adjustments 0 Net cash provided by operating activities 55 Investing Activities: Net cash used in investing activities 0 Financing Activities: Net cash used in financing activities Beginning cash and cash equivalents Ending cash and cash equivalents 0To assess the liquidity at the end of the year calculate Current Ratio and Acid-test (quick). Round your answers to 2 decimal places - for example 5.67 Calculate the Current Ratio Calculate the Acid-text (quick) ratio To assess asset management calculate Average collection period and Average sale period. Round your answers to 2 decimal places Calculate Average collection period - assume all sales are on account Calculate Average sale period - use 365 days in a year. To assess debt management calculate Debt-to-Equity ratio at the end of the year and Equity Multiplier. Round your calculations & answers to 2 decimal places Calculate Debt-to-Equity ratio Calculate Equity multiplier To assess profitability calculate Net Profit Margin Percentage and Return on Equity. Round your calculations & answers to 2 decimal place Calculate Net profit margin percentage Both 5a and 5b are to be expressed as a percent. Research if you are unsure how to express a number as a percent. Calculate Return on equity percentage To assess market performance, calculate Earnings Per Share and Dividend Payout Ratio. Assume the par value of the company's common stock is $10 per share Round your calculations & answers to 2 decimal places Calculate Earnings per share. Express in dollars and cents Calculate Dividend payout ratio - express in a percent. Assume the par value of the amb ie cin m
Step by Step Solution
There are 3 Steps involved in it

Get step-by-step solutions from verified subject matter experts