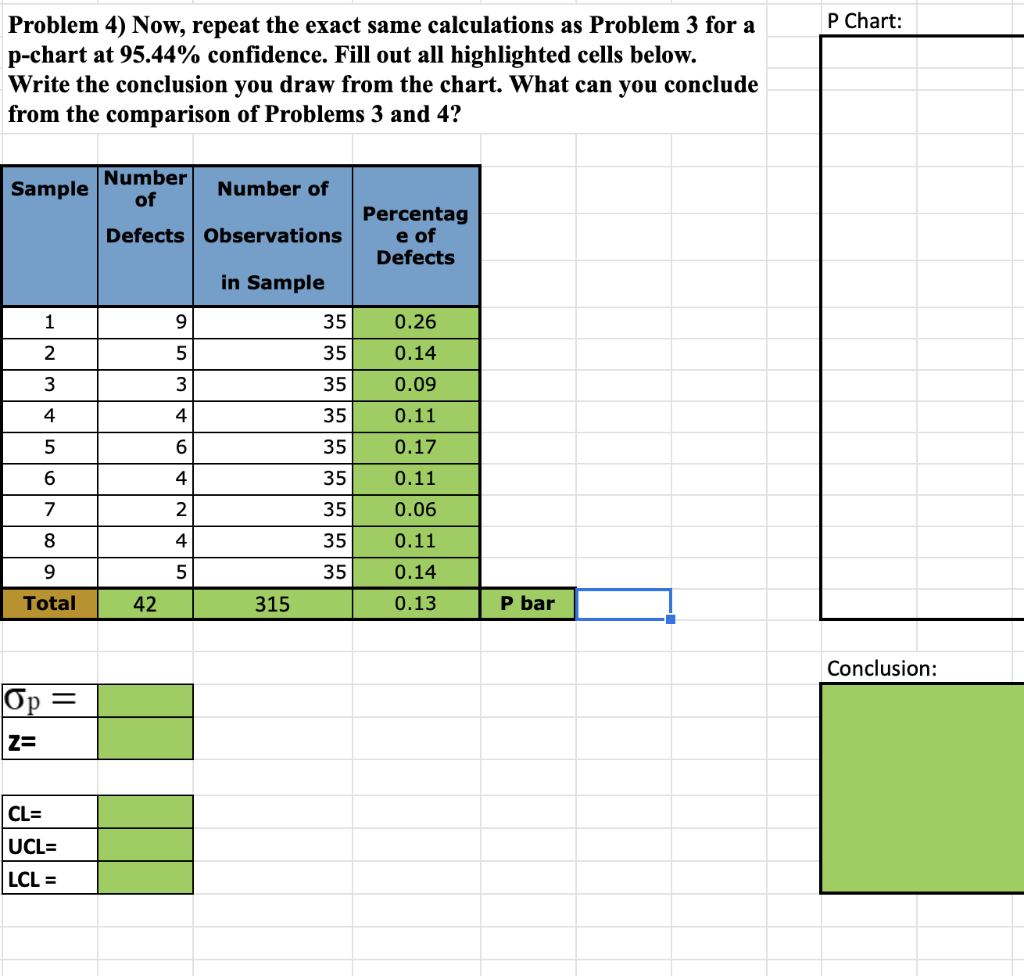
Question: P Chart: Problem 4) Now, repeat the exact same calculations as Problem 3 for a p-chart at 95.44% confidence. Fill out all highlighted cells below.

P Chart: Problem 4) Now, repeat the exact same

P Chart: Problem 4) Now, repeat the exact same calculations as Problem 3 for a p-chart at 95.44% confidence. Fill out all highlighted cells below. Write the conclusion you draw from the chart. What can you conclude from the comparison of Problems 3 and 4? Number Sample of Number of Defects Observations Percentag e of Defects in Sample 1 9 35 35 2 5 3 3 0.26 0.14 0.09 0.11 0.17 4 35 35 35 4 5 6 6 4 35 0.11 2 35 0.06 7 8 4 35 9 5 35 0.11 0.14 0.13 Total 42 315 Pbar Conclusion: Op = z= CL= UCLE LCL=

Step by Step Solution

There are 3 Steps involved in it

1 Expert Approved Answer
Step: 1 Unlock blur-text-image
Question Has Been Solved by an Expert!

Get step-by-step solutions from verified subject matter experts

Step: 2 Unlock
Step: 3 Unlock

Students Have Also Explored These Related General Management Questions!