

Question: P10.7 Write a program that draws a 3D view of a cylinder. 6 public class ChartViewer 7 { 8 9 10 11 12 13

![19 20 21 public static void main(String[] args) { orked_example_1/ChartFrame.java 22 23](https://dsd5zvtm8ll6.cloudfront.net/si.experts.images/questions/2024/01/65b934602d08c_38365b9345ff3ee0.jpg)
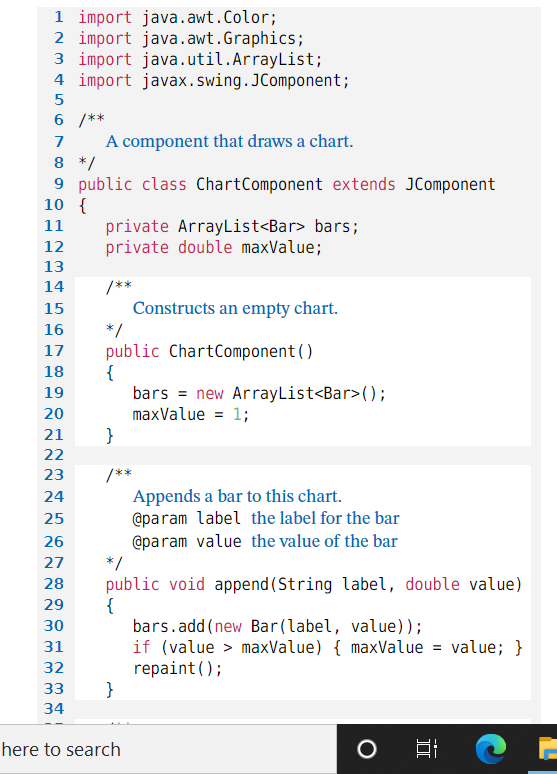
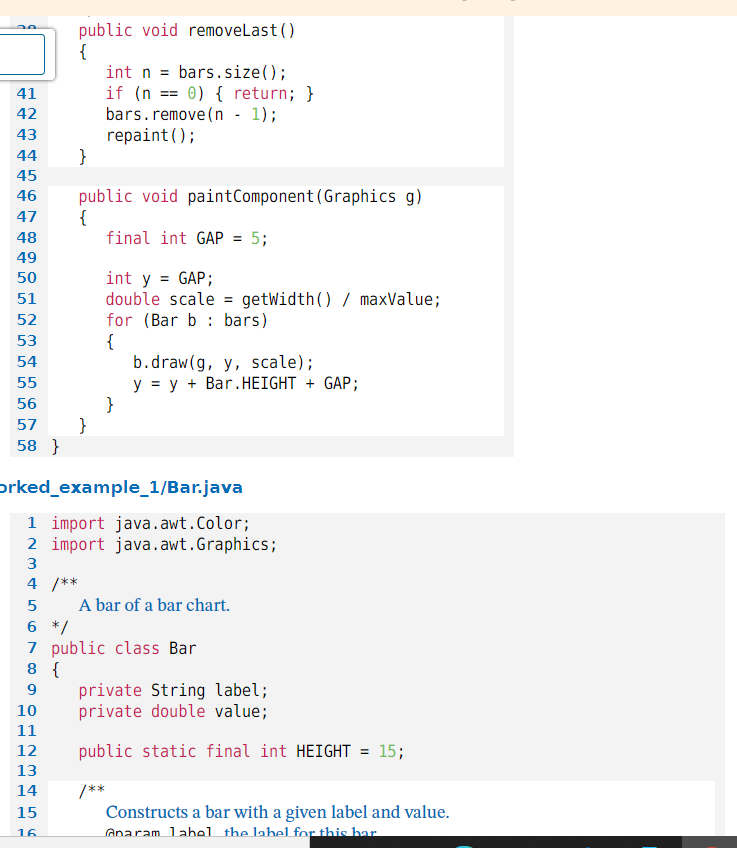
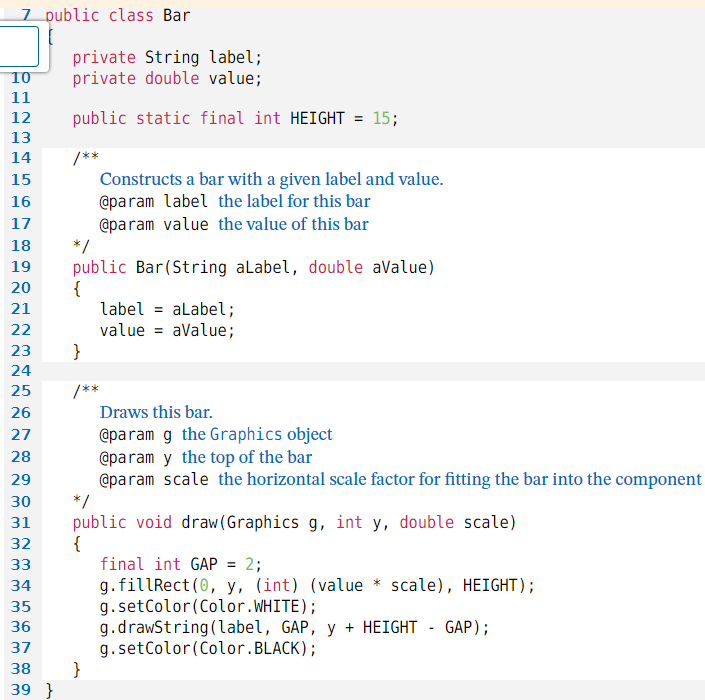
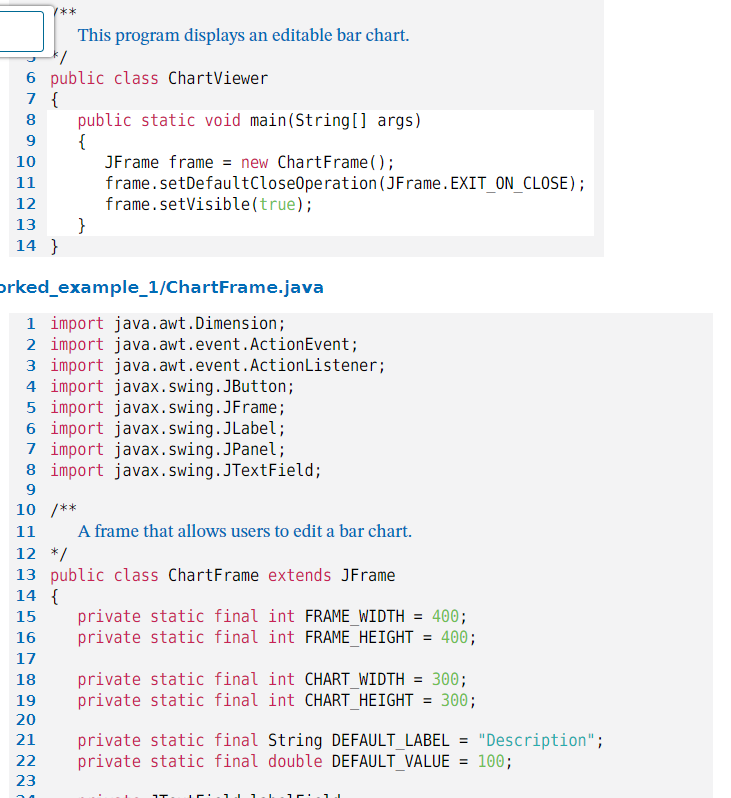
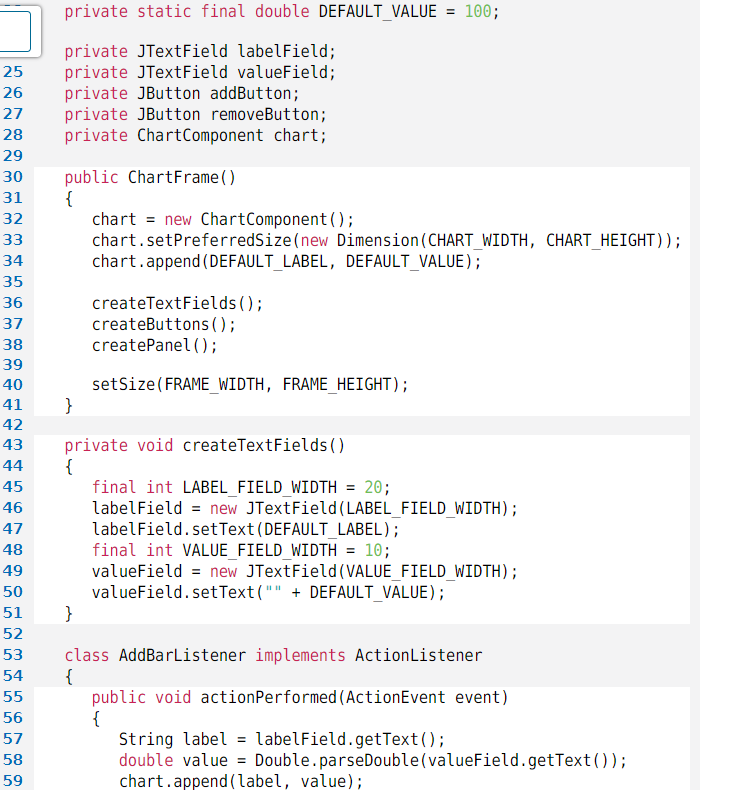
P10.7 Write a program that draws a 3D view of a cylinder. 6 public class ChartViewer 7 { 8 9 10 11 12 13 14 } /** This program displays an editable bar chart. 17 18 19 20 21 public static void main(String[] args) { orked_example_1/ChartFrame.java 22 23 24 } 1 import java.awt.Dimension; 2 import java.awt.event. ActionEvent; 3 import java.awt.event.ActionListener; 4 import javax.swing. JButton; 5 import javax.swing. JFrame; 6 import javax.swing. JLabel; JFrame frame = new Chart Frame(); frame.setDefaultCloseOperation (JFrame.EXIT_ON_CLOSE) ; frame.setVisible(true); 7 import javax.swing. JPanel; 8 import javax.swing.JTextField; 9 10 /** 11 12 */ 13 public class ChartFrame extends JFrame 14 { 15 16 A frame that allows users to edit a bar chart. private static final int FRAME_WIDTH = 400; private static final int FRAME HEIGHT = 400; private static final int CHART_WIDTH = 300; private static final int CHART_HEIGHT= 300; private static final String DEFAULT_LABEL private static final double DEFAULT_VALUE = "Description"; = 100; 25 26 27 28 29 30 31 32 33 34 35 36 37 38 39 40 41 42 43 44 45 46 47 48 49 50 51 52 53 54 55 56 57 58 59 private static final double DEFAULT_VALUE = private JTextField labelField; private JTextField valueField; private JButton addButton; private JButton removeButton; private ChartComponent chart; public ChartFrame() { } chart = new Chart Component(); chart.setPreferredSize (new Dimension (CHART_WIDTH, CHART_HEIGHT)); chart.append (DEFAULT_LABEL, DEFAULT_VALUE); createTextFields (); createButtons (); createPanel(); setSize (FRAME_WIDTH, FRAME_HEIGHT); 100; private void createTextFields () { final int LABEL_FIELD_WIDTH = 20; labelField = new JTextField (LABEL_FIELD_WIDTH); labelField.setText (DEFAULT_LABEL); final int VALUE_FIELD_WIDTH = 10; valueField = new JTextField (VALUE_FIELD_WIDTH); valueField.setText("" + DEFAULT_VALUE); } class AddBarListener implements ActionListener { public void action Performed (ActionEvent event) { String label = labelField.getText (); double value = Double.parseDouble (valueField.getText()); chart.append(label, value); 67 68 69 70 71 72 73 74 75 76 77 78 79 80 81 82 83 84 85 86 87 88 89 } } } public void createButtons() { } } chart.removeLast (); public void createPanel () { addButton = new JButton("Add"); addButton.addActionListener(new AddBarListener()); removeButton = new JButton ("Remove last"); removeButton.addActionListener(new RemoveBarListener()); e to search JPanel panel= new JPanel(); panel.add (labelField); panel.add (valueField); panel.add (addButton); panel.add (removeButton); panel.add (chart); add (panel); rked_example_1/ChartComponent.java 1 import java.awt.Color; 2 import java.awt.Graphics; 3 import java.util.ArrayList; 4 import javax.swing. JComponent; 5 6 /** A component that draws a chart. 7 8 */ 9 public class Chart Component extends JComponent 10 { stat.D... O 1 import java.awt.Color; 2 import java.awt.Graphics; 3 import java.util.ArrayList; 4 import javax.swing. JComponent; 5 6 7 8 */ 9 public class Chart Component extends JComponent 10 { 11 12 13 14 15 16 17 18 19 20 21 22 23 24 25 /** A component that draws a chart. private ArrayList bars; private double maxValue; /** */ public Chart Component() { 26 27 28 29 30 31 32 33 34 here to search Constructs an empty chart. } /** bars = new ArrayList (); maxValue = 1; } Appends a bar to this chart. @param label the label for the bar @param value the value of the bar */ public void append(String label, double value) { bars.add(new Bar (label, value)); if (value > maxValue) { maxValue = value; } repaint(); A 41 42 43 44 45 46 47 48 49 50 51 52 53 54 55 56 57 58 } public void removeLast () { } 10 11 12 13 14 15 16 public void paint Component ( Graphics g). { final int GAP 5; int y = GAP; double scale = getWidth() / maxValue; for (Bar b bars) { } int n = bars.size(); if (n =0) { return; } bars.remove(n - 1); repaint (); } orked_example_1/Bar.java b.draw(g, y, scale); y = y + Bar.HEIGHT + GAP; 1 import java.awt.Color; 2 import java.awt.Graphics; 3 4 /** 5 6 */ 7 public class Bar 8 { 9 A bar of a bar chart. /** private String label; private double value; public static final int HEIGHT = 15; Constructs a bar with a given label and value. Gnaram labol the label for this har 7 public class Bar 10 11 12 13 14 15 16 17 18 19 20 21 22 23 24 25 26 27 28 29 30 31 32 33 34 35 36 37 38 39 } private String label; private double value; public static final int HEIGHT = 15; /** Constructs a bar with a given label and value. @param label the label for this bar @param value the value of this bar */ public Bar (String aLabel, double aValue) { label aLabel; value= aValue; } /** } Draws this bar. @param g the Graphics object @param y the top of the bar @param scale the horizontal scale factor for fitting the bar into the component */ public void draw (Graphics g, int y, double scale) { final int GAP = 2; g. fillRect(0, y, (int) (value scale), HEIGHT); g.setColor (Color.WHITE); g.drawstring(label, GAP, y + HEIGHT - GAP); g.setColor (Color.BLACK);
Step by Step Solution
There are 3 Steps involved in it
Drawing a 3D view of a cylinder requires the use of a graphical library like Matplotlib in Python He... View full answer

Get step-by-step solutions from verified subject matter experts