

Question: P2: The voice spectra for two different sounds are shown below. In each spectrum, each vertical line under the envelope curve represents the strength of

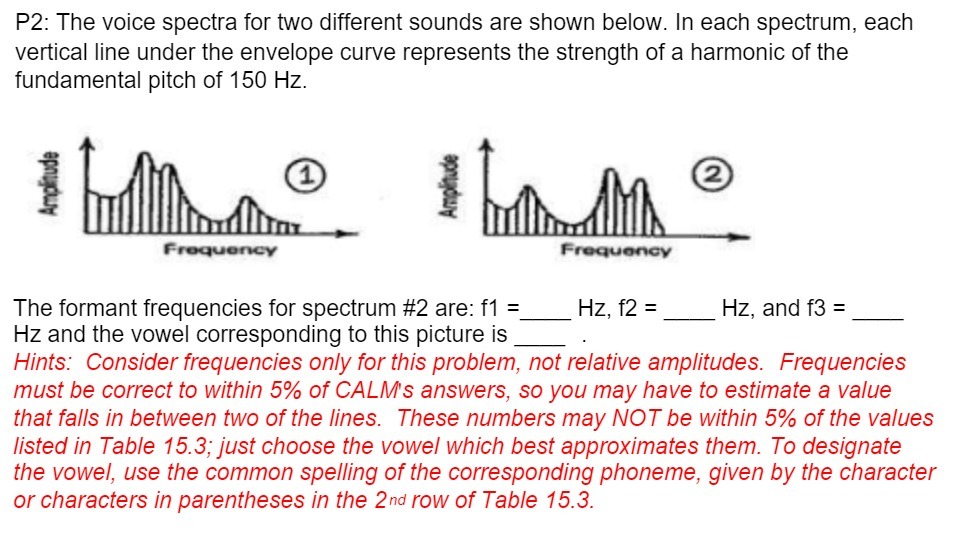
P2: The voice spectra for two different sounds are shown below. In each spectrum, each vertical line under the envelope curve represents the strength of a harmonic of the fundamental pitch of 150 Hz. 1 '9 1 The formant frequencies for spectrum #2 are: f1- _Hz, f2 = _Hz, and f3 = Hz and the vowel corresponding to this picture is _ Hints: Consider frequencies only for this problem not relative amplitudes. Frequencies must be correct to within 5% of CALMs answers so you may have to estimate a value that falls in between two of the lines. These numbers may NOT be within 5% of the values listed in Table 15.3; just choose the vowei which best approximates them. To designate the vowel, use the common spelling of the corresponding phoneme, given by the character or characters in parentheses in the 2nd row of Table 15.3
Step by Step Solution
There are 3 Steps involved in it

Get step-by-step solutions from verified subject matter experts