

Question: Part A (Figure 1) Figure (a) is a snapshot graph at t = 0 s of two wave pulses approaching each other at 1.0 m/s.
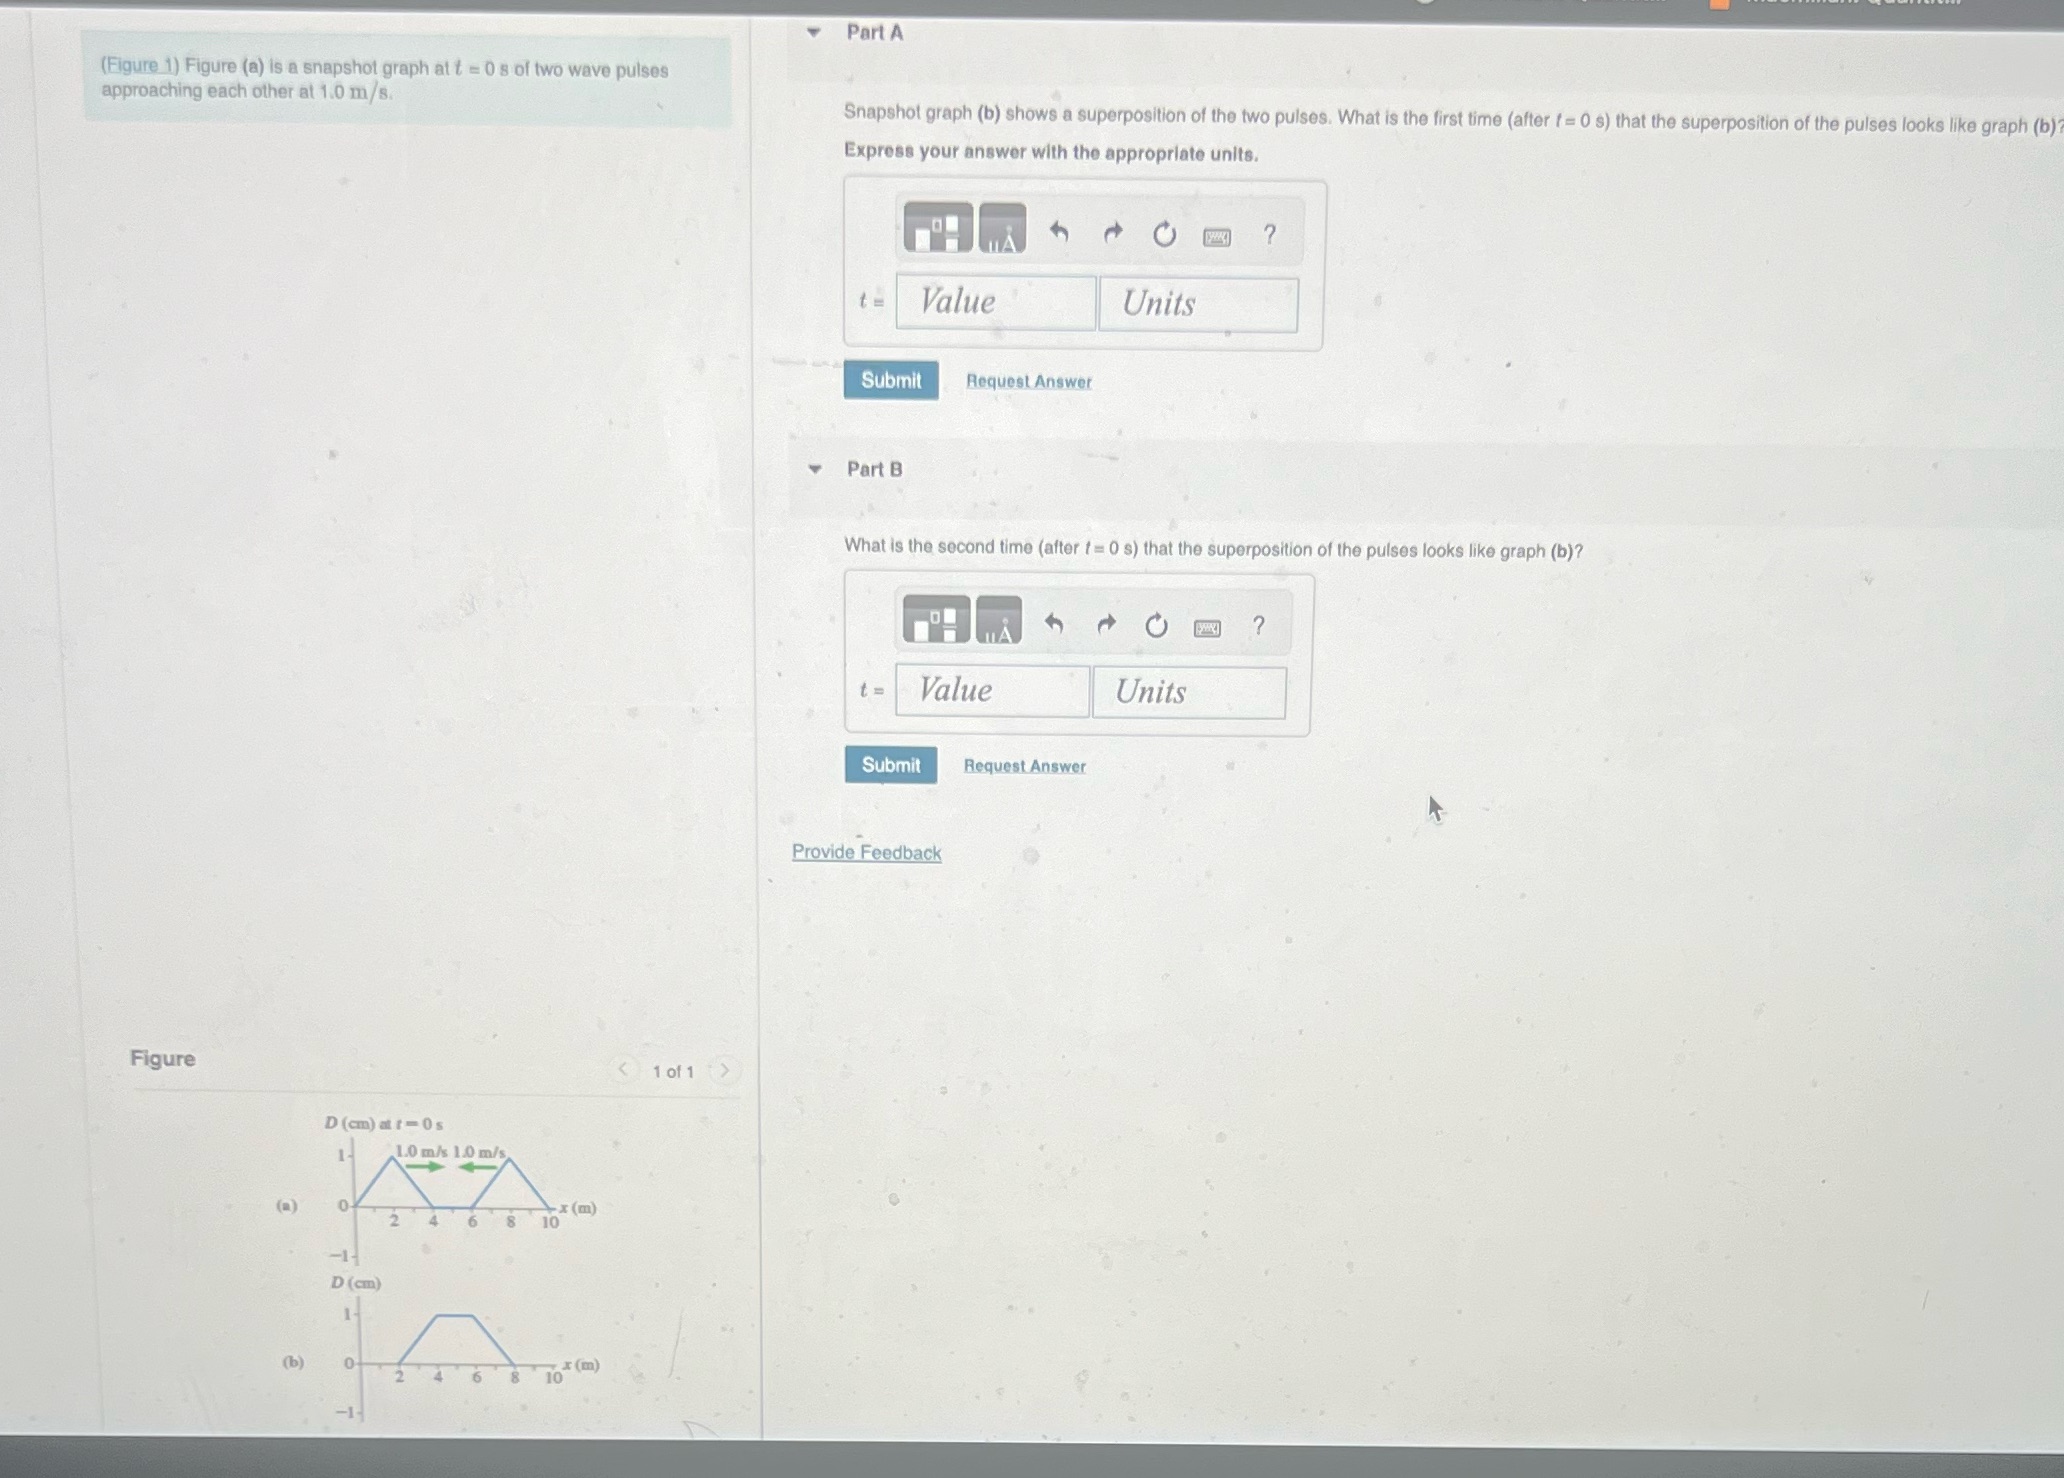
Part A (Figure 1) Figure (a) is a snapshot graph at t = 0 s of two wave pulses approaching each other at 1.0 m/s. Snapshot graph (b) shows a superposition of the two pulses. What is the first time (after ( = 0 s) that the superposition of the pulses looks like graph (b) Express your answer with the appropriate units. t = Value Units Submit Request Answer Part B What is the second time (after { = 0 s) that the superposition of the pulses looks like graph (b)? t = Value Units Submit Request Answer Provide Feedback Figure D (cm) at r = 0s 1.0 m/s 1.0 m/s 2 10 -1 D (cm) b x (m) 10 -1
Step by Step Solution
There are 3 Steps involved in it
1 Expert Approved Answer
Step: 1 Unlock

Question Has Been Solved by an Expert!
Get step-by-step solutions from verified subject matter experts
Step: 2 Unlock
Step: 3 Unlock