

Question: Part A (Figure 1) The figure shows a snapshot graph at t = 0 s of two wave pulses approaching each other at 1.0 m/s.
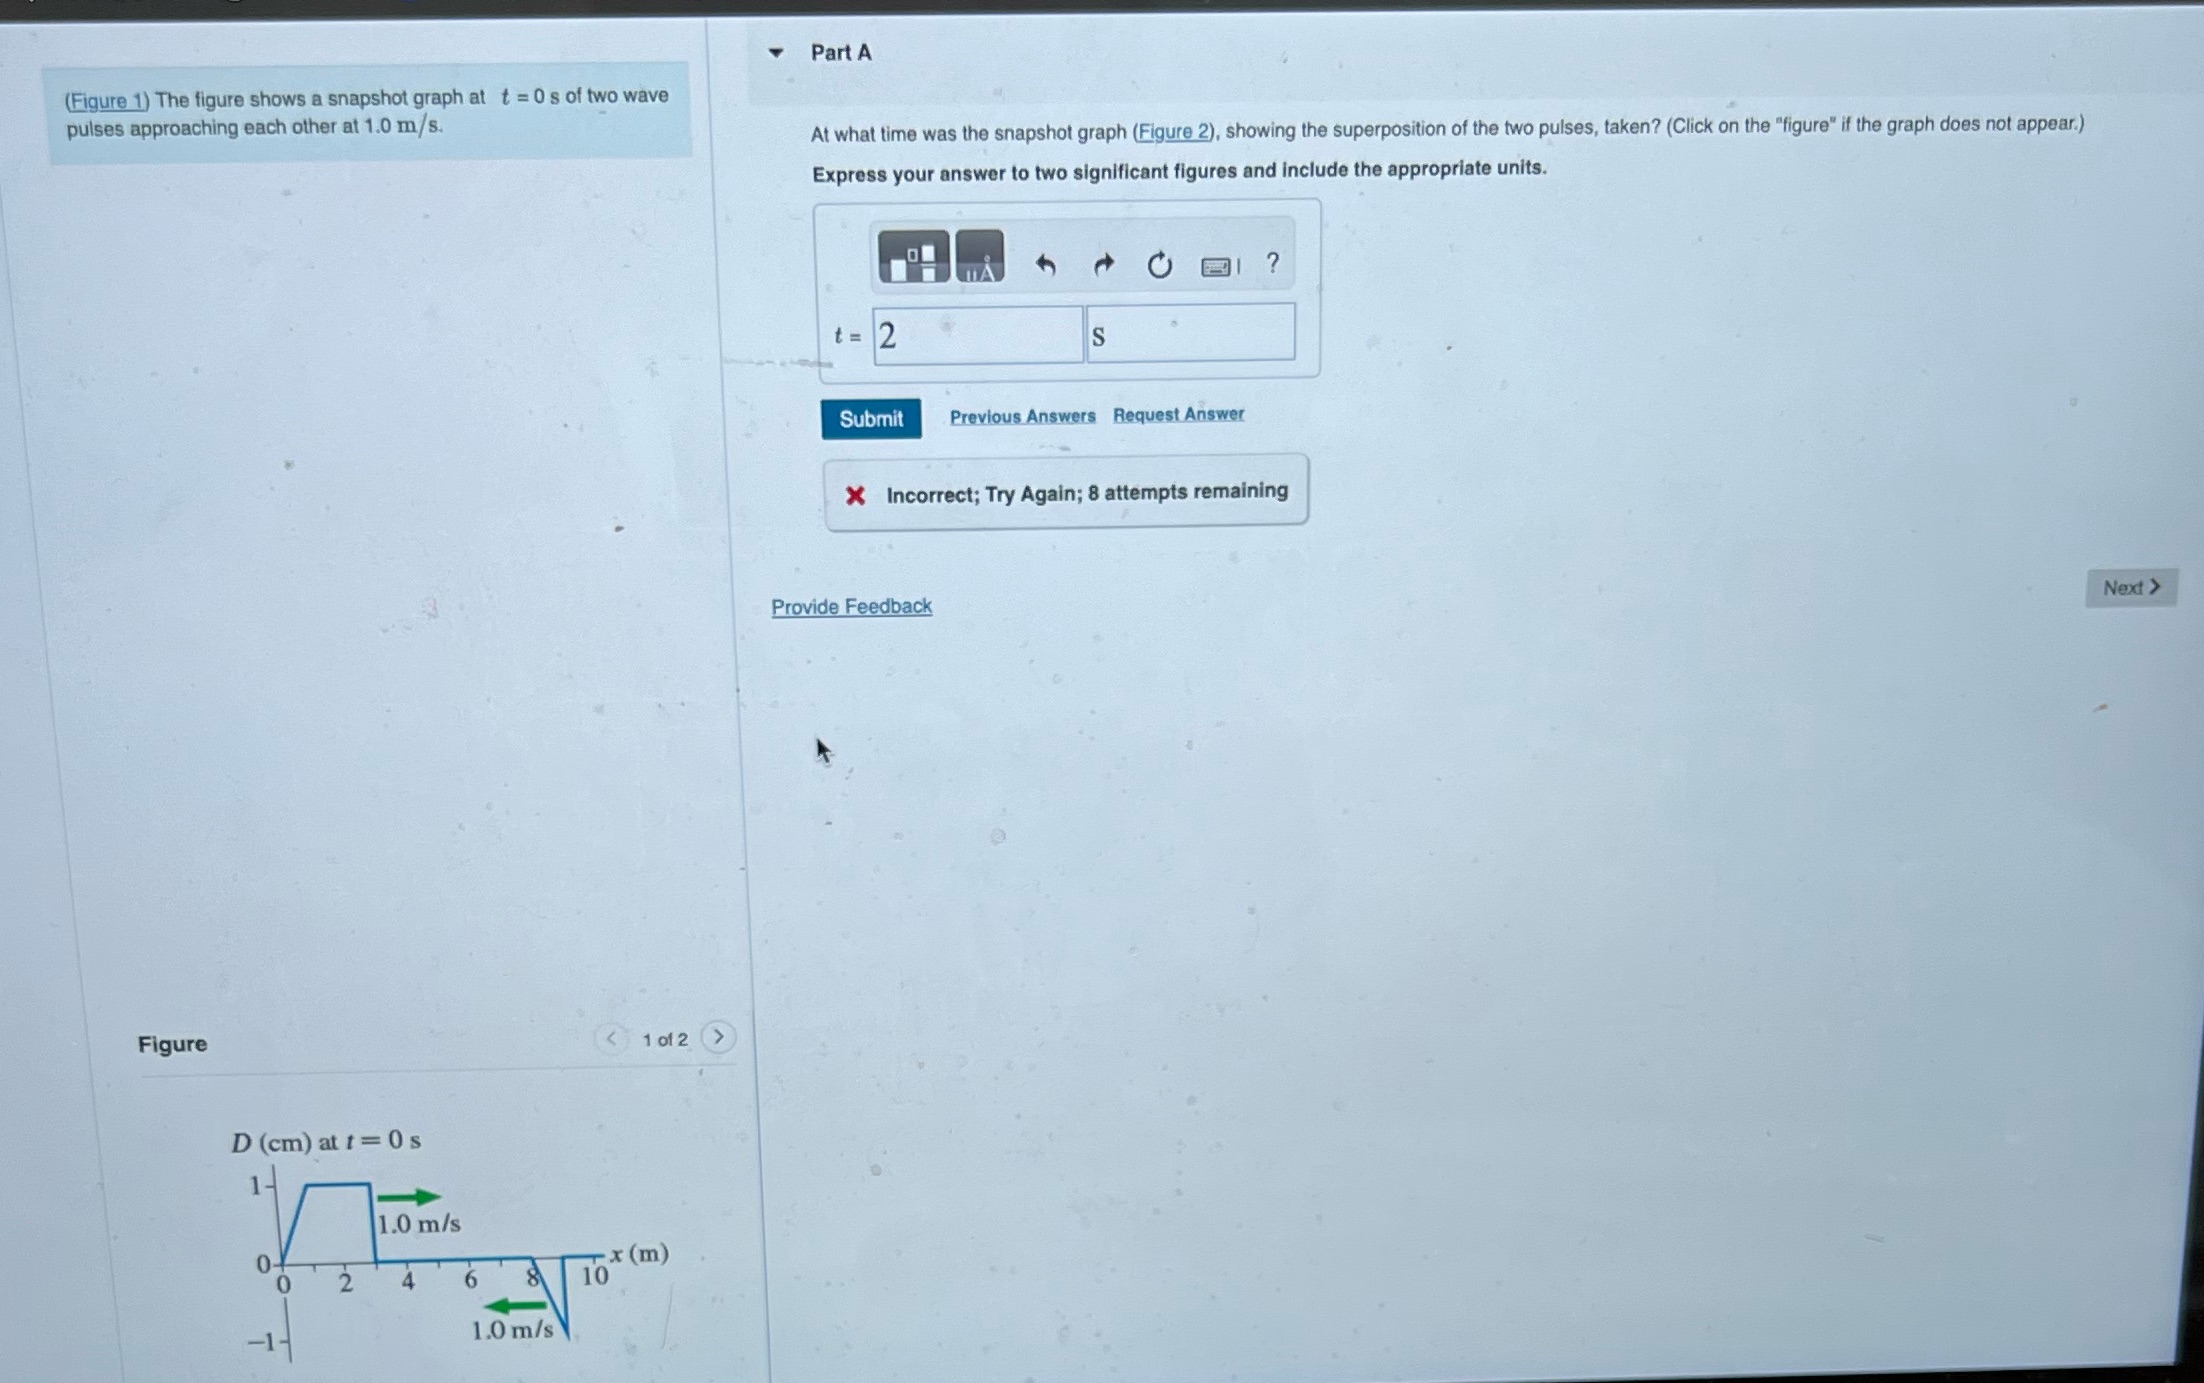
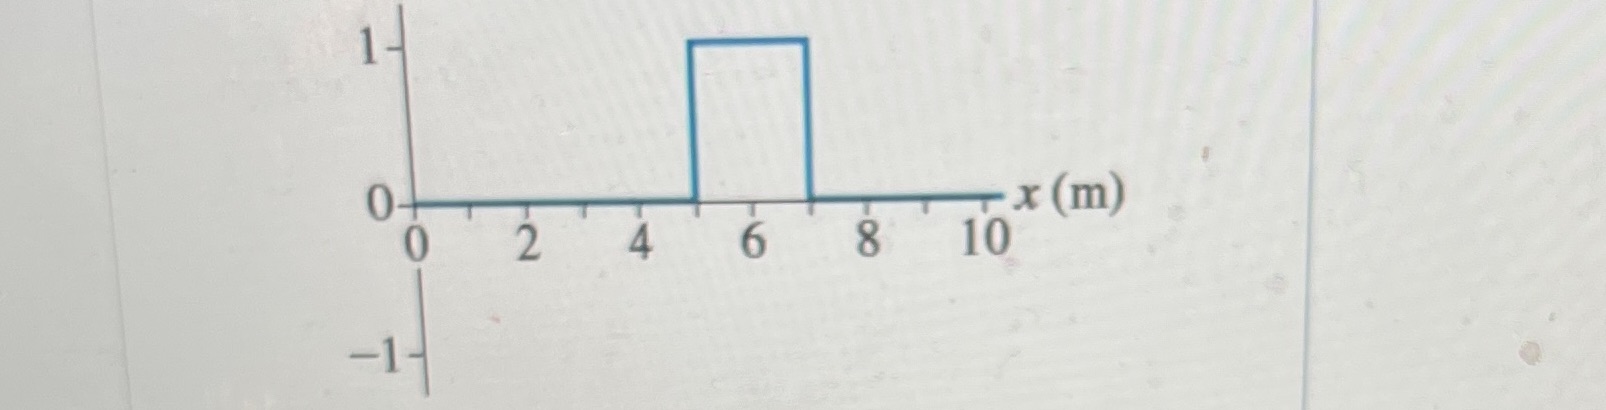
Part A (Figure 1) The figure shows a snapshot graph at t = 0 s of two wave pulses approaching each other at 1.0 m/s. At what time was the snapshot graph (Figure 2), showing the superposition of the two pulses, taken? (Click on the "figure" if the graph does not appear.) Express your answer to two significant figures and include the appropriate units. t = 2 S Submit Previous Answers Request Answer X Incorrect; Try Again; 8 attempts remaining Provide Feedback Next > Figure D (cm) at t = 0 s 1.0 m/s x (m) 8 10 1.0 m/s
Step by Step Solution
There are 3 Steps involved in it
1 Expert Approved Answer
Step: 1 Unlock

Question Has Been Solved by an Expert!
Get step-by-step solutions from verified subject matter experts
Step: 2 Unlock
Step: 3 Unlock