

Question: Part II (Two problems; points are 8&2 points respectively) In #5, display all the fields mentioned; but do NOT display any field that is not
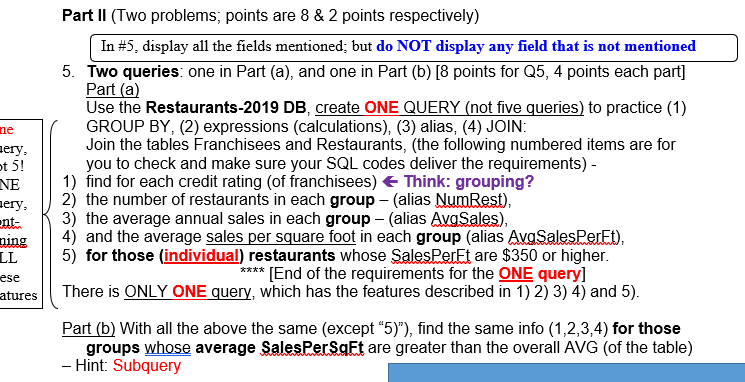
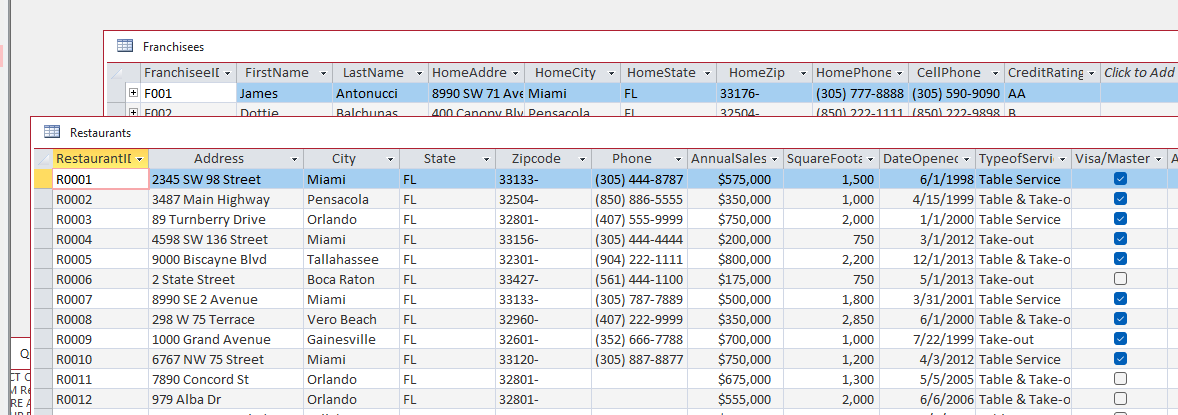
Part II (Two problems; points are 8&2 points respectively) In \#5, display all the fields mentioned; but do NOT display any field that is not mentioned 5. Two queries: one in Part (a), and one in Part (b) [8 points for Q5, 4 points each part] Part (a) Use the Restaurants-2019 DB, create ONE QUERY (not five queries) to practice (1) GROUP BY, (2) expressions (calculations), (3) alias, (4) JOIN: Join the tables Franchisees and Restaurants, (the following numbered items are for you to check and make sure your SQL codes deliver the requirements) - 1) find for each credit rating (of franchisees) = Think: grouping? 2) the number of restaurants in each group - (alias NumRest), 3) the average annual sales in each group - (alias AvgSales), 4) and the average sales per square foot in each group (alias AvgSalesPerF), 5) for those (individual) restaurants whose SalesPerFt are $350 or higher. [End of the requirements for the ONE query] There is ONLY ONE query, which has the features described in 1) 2) 3) 4) and 5). Part (b) With all the above the same (except "5)"), find the same info (1,2,3,4) for those groups whose average SalesPerSqFt are greater than the overall AVG (of the table) - Hint: Subquery Franchisees Restaurants Part II (Two problems; points are 8&2 points respectively) In \#5, display all the fields mentioned; but do NOT display any field that is not mentioned 5. Two queries: one in Part (a), and one in Part (b) [8 points for Q5, 4 points each part] Part (a) Use the Restaurants-2019 DB, create ONE QUERY (not five queries) to practice (1) GROUP BY, (2) expressions (calculations), (3) alias, (4) JOIN: Join the tables Franchisees and Restaurants, (the following numbered items are for you to check and make sure your SQL codes deliver the requirements) - 1) find for each credit rating (of franchisees) = Think: grouping? 2) the number of restaurants in each group - (alias NumRest), 3) the average annual sales in each group - (alias AvgSales), 4) and the average sales per square foot in each group (alias AvgSalesPerF), 5) for those (individual) restaurants whose SalesPerFt are $350 or higher. [End of the requirements for the ONE query] There is ONLY ONE query, which has the features described in 1) 2) 3) 4) and 5). Part (b) With all the above the same (except "5)"), find the same info (1,2,3,4) for those groups whose average SalesPerSqFt are greater than the overall AVG (of the table) - Hint: Subquery Franchisees Restaurants
Step by Step Solution
There are 3 Steps involved in it
To solve the problem we need to construct SQL queries for both Part a and Part b using the given dat... View full answer

Get step-by-step solutions from verified subject matter experts