

Question: PITIES Question 6 1. Make a scatter plot with on the vertical axis the historical average excess return of all stocks and on the horizontal
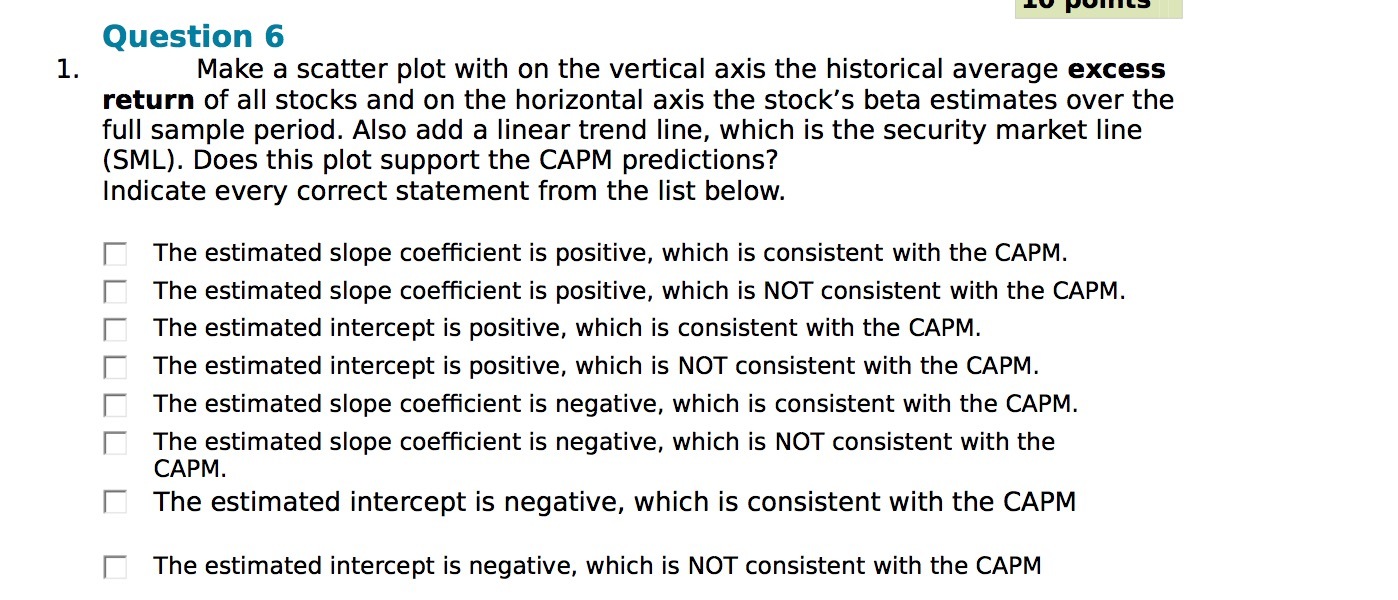

PITIES Question 6 1. Make a scatter plot with on the vertical axis the historical average excess return of all stocks and on the horizontal axis the stock's beta estimates over the full sample period. Also add a linear trend line, which is the security market line (SML). Does this plot support the CAPM predictions? Indicate every correct statement from the list below. The estimated slope coefficient is positive, which is consistent with the CAPM. The estimated slope coefficient is positive, which is NOT consistent with the CAPM. The estimated intercept is positive, which is consistent with the CAPM. 000000 The estimated intercept is positive, which is NOT consistent with the CAPM. The estimated slope coefficient is negative, which is consistent with the CAPM. The estimated slope coefficient is negative, which is NOT consistent with the CAPM. The estimated intercept is negative, which is consistent with the CAPM The estimated intercept is negative, which is NOT consistent with the CAPM
Step by Step Solution
There are 3 Steps involved in it

Get step-by-step solutions from verified subject matter experts