

Question: PLAN 1 FOR THE ROOFING SUPPLER-A CONSTANT WORKFORCE One possible strategy (call it plan 1) for the manufacturer described in Example 1 is to maintain
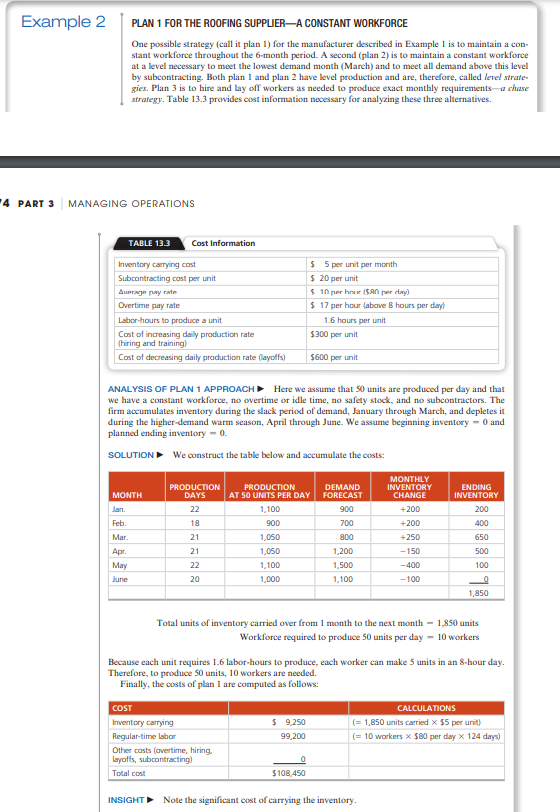
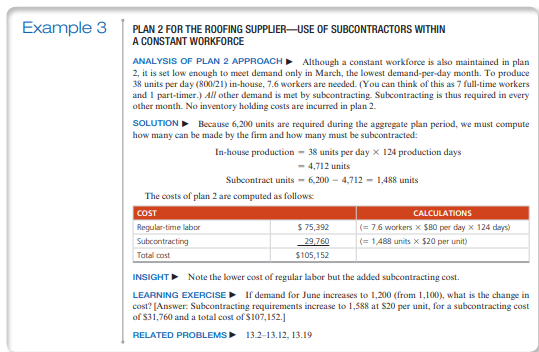
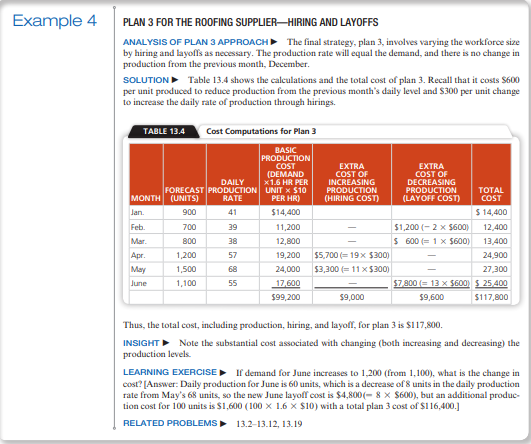
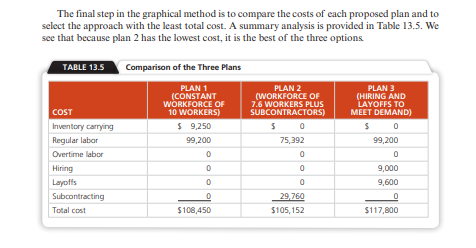
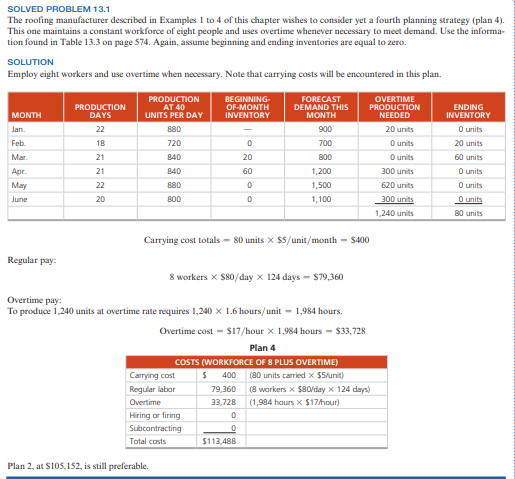
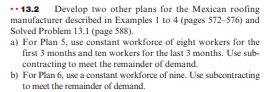
PLAN 1 FOR THE ROOFING SUPPLER-A CONSTANT WORKFORCE One possible strategy (call it plan 1) for the manufacturer described in Example 1 is to maintain a constant workforce throughout the 6-month period. A second (plan 2) is to maintain a constant workforce at a level necessary to meet the lowest demand month (March) and to meet all demand above this level by subcontracting. Both plan 1 and plan 2 have level production and are, therefore, called level strategies. Plan 3 is to hire and lay off workers as needed to produce exact monthly requirements-a chase strategy. Table 13.3 provides cost information necessary for analyzing these three alternatives. GING OPERATIONS ANALYSIS OF PLAN 1 APPAOACH Here we assume that 50 units are produced per day and that we have a constant workforce, no overtime or idle time, no safety stock, and no subcontractors. The firm accumulates inventory during the slack period of demand, January through March, and depletes it during the higher-demand warm season, April through June. We assume beginning inventory =0 and planned ending inventory =0. SOLUTION We construct the table below and accumulate the costs: Total units of inventory carried over from 1 month to the next month 1,850 units Workforce required to produce 50 units per day - 10 workers Because each unit requires 1.6 labor-hours to produce, each worker can make 5 units in an 8 -hour day. Therefore, to produce 50 units, 10 workers are needed. Finally, the costs of plan 1 are computed as follows: INSIGHT Note the significant cost of carrying the inventory. PLAN 2 FOR THE ROOFING SUPPUER-USE OF SUBCONTRACTORS WITHIN A CONSTANT WORKFORCE ANALYSIS OF PLAN 2 APPROACH Although a constant workforce is also maintained in plan 2, it is set low enough to meet demand only in March, the lowest demand-per-day month. To produce 38 units per day (800/21 ) in-house, 7.6 workers are needed. (You can think of this as 7 full-time workers and 1 part-timer.) All other demand is met by subcontracting. Subeontracting is thus required in every other month. No inventory holding costs are incurred in plan 2. SOLUTION Because 6,200 units are required during the aggregate plan period, we must compute how many can be made by the firm and how many must be subcontracted: In-house production -38 units per day 124 production days 4,712 units Subcontract units 6,2004,7121,488 units The costs of plan 2 are computed as follows: INSIGHT Note the lower cost of regular labor but the added subcontracting cost. LEARNING EXERCISE If demand for June increases to 1,200 (from 1,100), what is the change in cost? [Answer: Subcontracting requirements increase to 1,588 at $20 per unit, for a subcontracting cost of $31,760 and a total cost of $107,152.] RELATED PAOBLEMS 13.2-13.12, 13.19 PLAN 3 FOR THE ROOFING SUPPLIERHIRING AND LAYOFFS ANALYSIS OF PLAN 3 APPROACH The final strategy, plan 3, involves varying the workforce size by hiring and layoffs as necessary. The production rate will equal the demand, and there is no change in production from the previous month, December. SOLUTION - Table 13.4 shows the calculations and the total cost of plan 3. Recall that it costs $600 per unit produced to reduce production from the previous month's daily level and $300 per unit change to increase the daily rate of production through hirings. Thus, the total cost, including production, hiring, and layoff, for plan 3 is $117,800. INSIGHT Note the substantial cost associated with changing (both increasing and decreasing) the production levels. LEARNING EXERCISE If demand for June increases to 1,200 (from 1,100), what is the change in cost? [Answer: Daily production for June is 60 units, which is a decrease of 8 units in the daily production rate from May's 68 units, so the new June layoff cost is $4,800(8$600), but an additional production cost for 100 units is $1,600(1001.6$10) with a total plan 3 cost of $116,400.] RELATED PAOBLEMS 13.213.12,13.19 The final step in the graphical method is to compare the costs of each proposed plan and to select the approach with the least total cost. A summary analysis is provided in Table 13.5. We see that because plan 2 has the lowest cost, it is the best of the three options SOLVED PROBLEM 13.1 The rooling manufacturer described in Examples 1 to 4 of this chapter wishes to consider yet a fourth planning strategy (plan 4 ). This one maintains a constant workforce of eight people and uses overtime whenever necessary to meet demand. Use the information found in Table 13.3 on page 574. Again, assume beginning and ending inventories are equal to zero. SOLUTION Employ eight workers and use overtime when necessary. Note that carrying costs will be encountered in this plan. Carryingcosttotals=80units$5/unit/month$400 Regular pay: 8workers$80/day124days=$79,360 Overtime pay: To produce 1,240 units at overtime rate requires 1,2401.6 hours/unit 1,984 hours. Overtimecost$17/hour1,984hours$33,728 Plan 2 , at $105,152, is still preferable. "-13.2 Develop two other plans for the Mexican roofing manufacturer described in Examples 1 to 4 (pages 572-576) and Solved Problem 13.1 (page 588 ). a) For Plan 5 , use constant workforce of eight workers for the first 3 months and ten workers for the last 3 months. Use subcontracting to meet the remainder of demand. b) For Plan 6, use a constant workforce of nine. Use subcontracting to meet the remainder of demand
Step by Step Solution
There are 3 Steps involved in it

Get step-by-step solutions from verified subject matter experts