Question: Please Answer All B D H E F 8.15 Average and Range Chart. Calculate the Upper and Lower Control Limits if: X-double bar = .490,

Please Answer All Please Answer All B D H E F 8.15 Average and
B D H E F 8.15 Average and Range Chart. Calculate the Upper and Lower Control Limits if: X-double bar = .490, n = 10, and R-bar = 210. 8.15A Calculate Sigma Hat if R-bar is 2.75 and n = 7. 8.16 Average and Sigma Chart. Calculate the Upper and Lower Control Limits if: X-double bar = .700, n = 5, and s-bar = .100. 8.17 x and MR Chart. Calculate the Upper and Lower Control Limits if: x-bar = 4.00, n = 2, and R-bar = .280

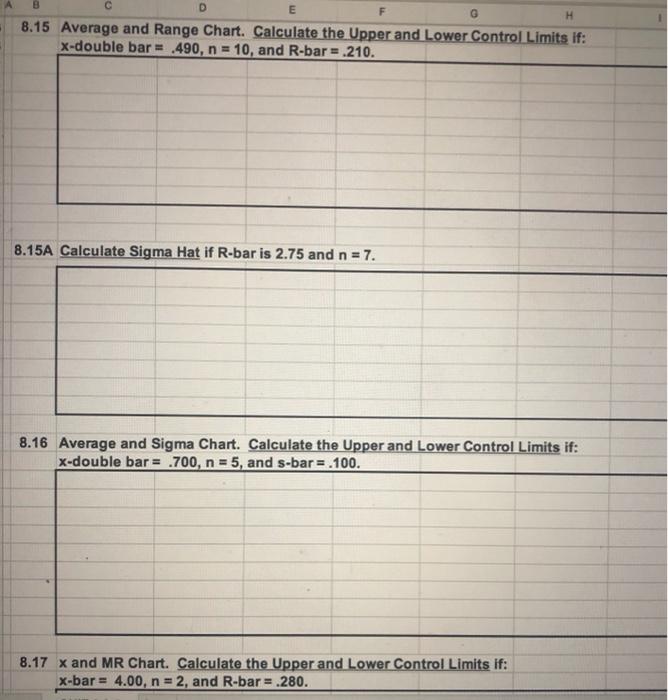
Step by Step Solution

There are 3 Steps involved in it

1 Expert Approved Answer
Step: 1 Unlock blur-text-image
Question Has Been Solved by an Expert!

Get step-by-step solutions from verified subject matter experts

Step: 2 Unlock
Step: 3 Unlock

Students Have Also Explored These Related General Management Questions!