

Question: Please answer all parts - . s6.11 Twelve samples, each containing five parts, were taken from a process that produces steel rods. The length of
Please answer all parts
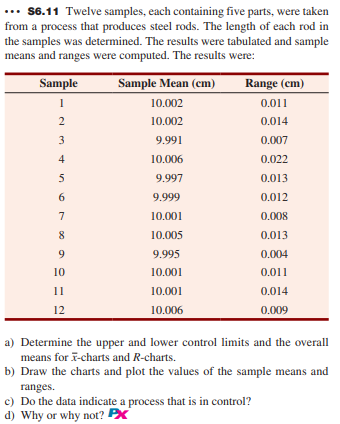
- . s6.11 Twelve samples, each containing five parts, were taken from a process that produces steel rods. The length of each rod in the samples was determined. The results were tabulated and sample means and ranges were computed. The results were: a) Determine the upper and lower control limits and the overall means for x-charts and R-charts. b) Draw the charts and plot the values of the sample means and ranges. c) Do the data indicate a process that is in control? d) Why or why notStep by Step Solution
There are 3 Steps involved in it
1 Expert Approved Answer
Step: 1 Unlock

Question Has Been Solved by an Expert!
Get step-by-step solutions from verified subject matter experts
Step: 2 Unlock
Step: 3 Unlock