

Question: Please answer all questions and explain how to enter into Microsoft Excel In 1991, the U.S. Fish and Wildlife Service proposed logging restrictions on nearly
Please answer all questions and explain how to enter into Microsoft Excel
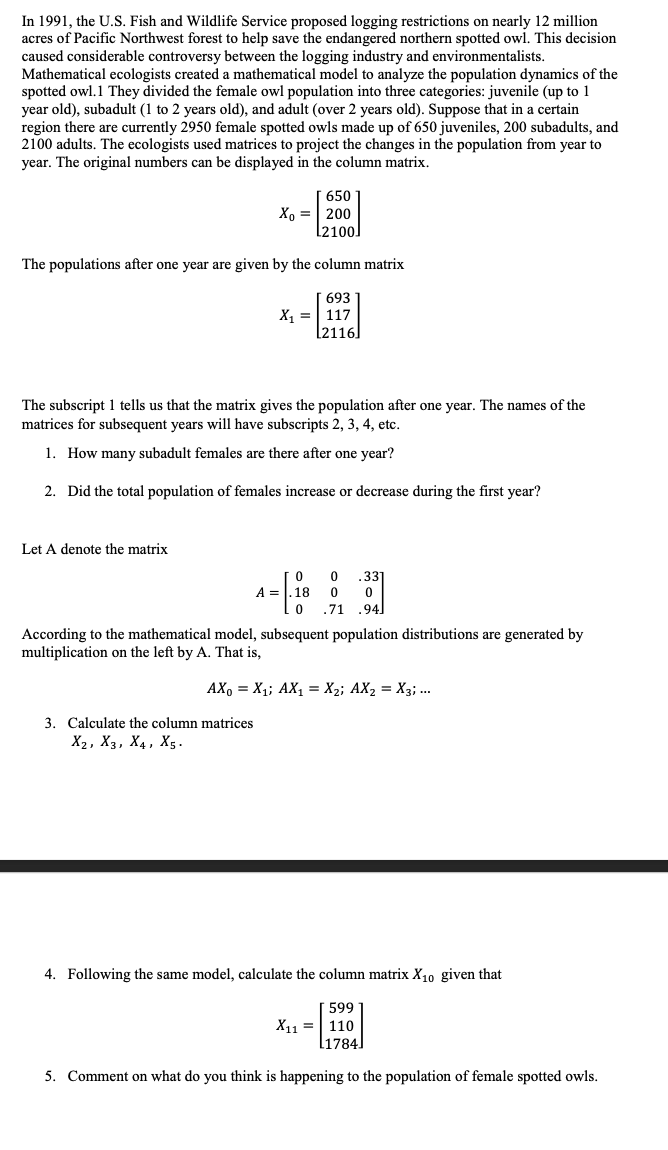
In 1991, the U.S. Fish and Wildlife Service proposed logging restrictions on nearly 12 million acres of Pacific Northwest forest to help save the endangered northern spotted owl. This decision caused considerable controversy between the logging industry and environmentalists. Mathematical ecologists created a mathematical model to analyze the population dynamics of the spotted owl.1 They divided the female owl population into three categories: juvenile (up to 1 year old), subadult (1 to 2 years old), and adult (over 2 years old). Suppose that in a certain region there are currently 2950 female spotted owls made up of 650 juveniles, 200 subadults, and 2100 adults. The ecologists used matrices to project the changes in the population from year to year. The original numbers can be displayed in the column matrix. 650 XO = 200 2100 The populations after one year are given by the column matrix 693 X, = 117 2116) The subscript 1 tells us that the matrix gives the population after one year. The names of the matrices for subsequent years will have subscripts 2, 3, 4, etc. 1. How many subadult females are there after one year? 2. Did the total population of females increase or decrease during the first year? Let A denote the matrix 0 0 .337 A = .18 0 0 0 .71 .94 According to the mathematical model, subsequent population distributions are generated by multiplication on the left by A. That is, AXO = X1; AX1 = X2; AX2 = X3; .. 3. Calculate the column matrices Xz, X3, X4, X5. 4. Following the same model, calculate the column matrix X10 given that 599 X1 = 110 1784 5. Comment on what do you think is happening to the population of female spotted owls
Step by Step Solution
There are 3 Steps involved in it

Get step-by-step solutions from verified subject matter experts