

Question: please answer all questions and I'll upvote your answer A quality analyst wants to construct a sample mean chart for controlling a packaging process. Ho
please answer all questions and I'll upvote your answer 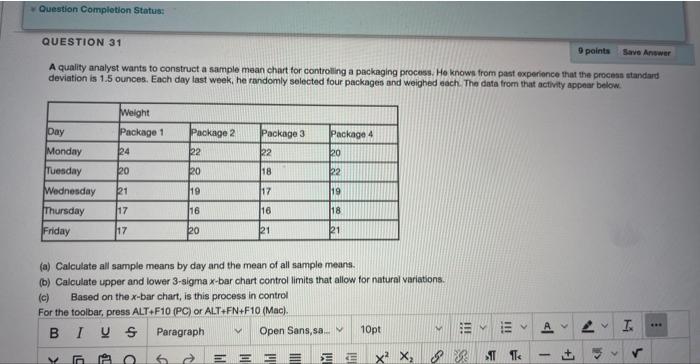
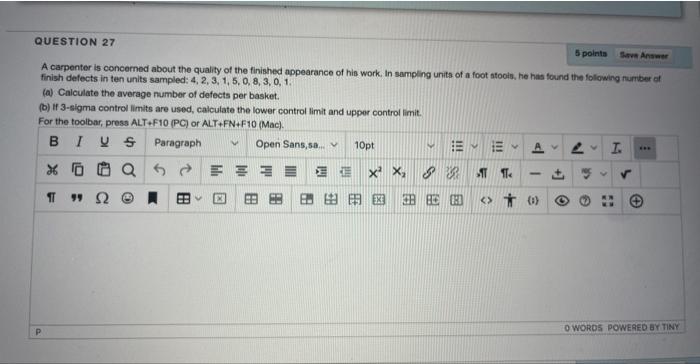
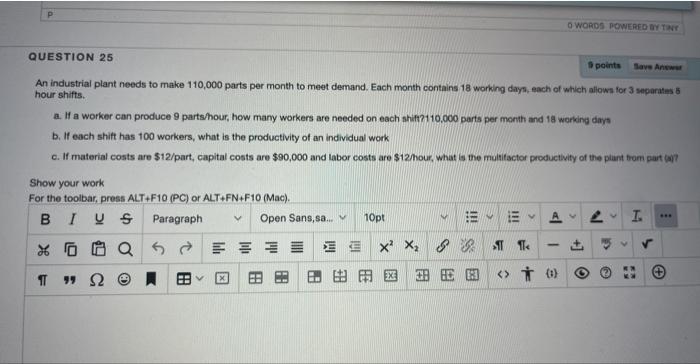
A quality analyst wants to construct a sample mean chart for controlling a packaging process. Ho known from past experionce that the procesa atandard deviation is 1.5 ounces. Each day last week, he randomly selected four packages and weighed each. The data from that activity appear below. (a) Calculate all sample means by day and the mean of all sample means. (b) Calculate upper and lower 3-sigma x-bar chart control limits that allow for natural variations. (c) Based on the x-bar chart, is this process in control A carpenter is concerned about the quality of the finished appearance of his work. In sampling units of a foot atoois, he has found the following number of finish defects in ten units sampled: 4,2,3,1,5,0,8,3,0,1. (a) Calculate the average number of defects per basket. (b) If 3-eigma control limits are used, calculate the lower control limit and upper control limit. An industrial plant needs to make 110,000 parts per month to meet demand. Each month contains 18 working dayn, each of which alfows for 3 separatas 6 hour shifts. a. If a worker can produce 9 parts hour, how many workers are needed on each shift?110.000 parts per month and 18 working days b. If each shift has 100 workers, what is the productivity of an individual work c. If material costs are $12/ part, capital costs are $90,000 and labor costs are $12 fhour, What is the multifactor productivity of the plant trom part (a) Show your work
Step by Step Solution
There are 3 Steps involved in it
1 Expert Approved Answer
Step: 1 Unlock

Question Has Been Solved by an Expert!
Get step-by-step solutions from verified subject matter experts
Step: 2 Unlock
Step: 3 Unlock