Question: A quality analyst wants to construct a control chart for determining whether three machines, all producing the same product, are in control with regard to
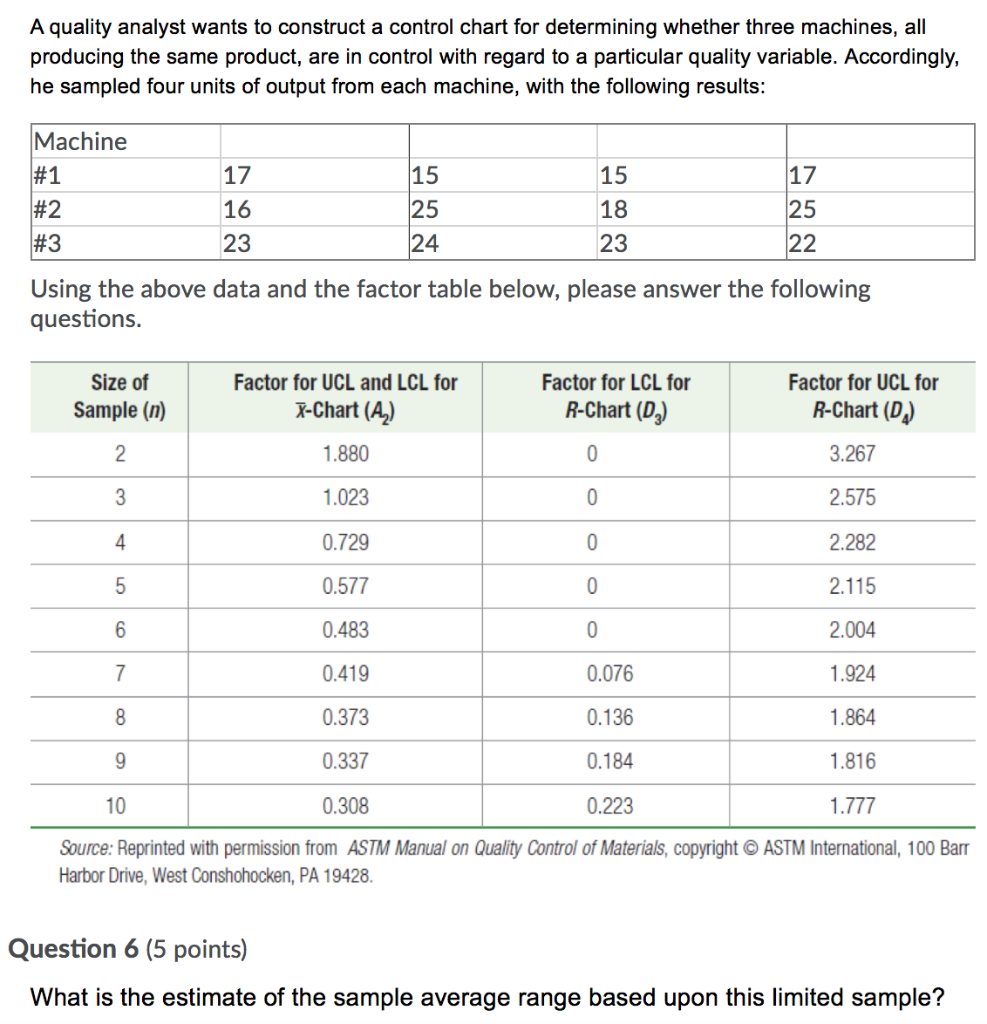
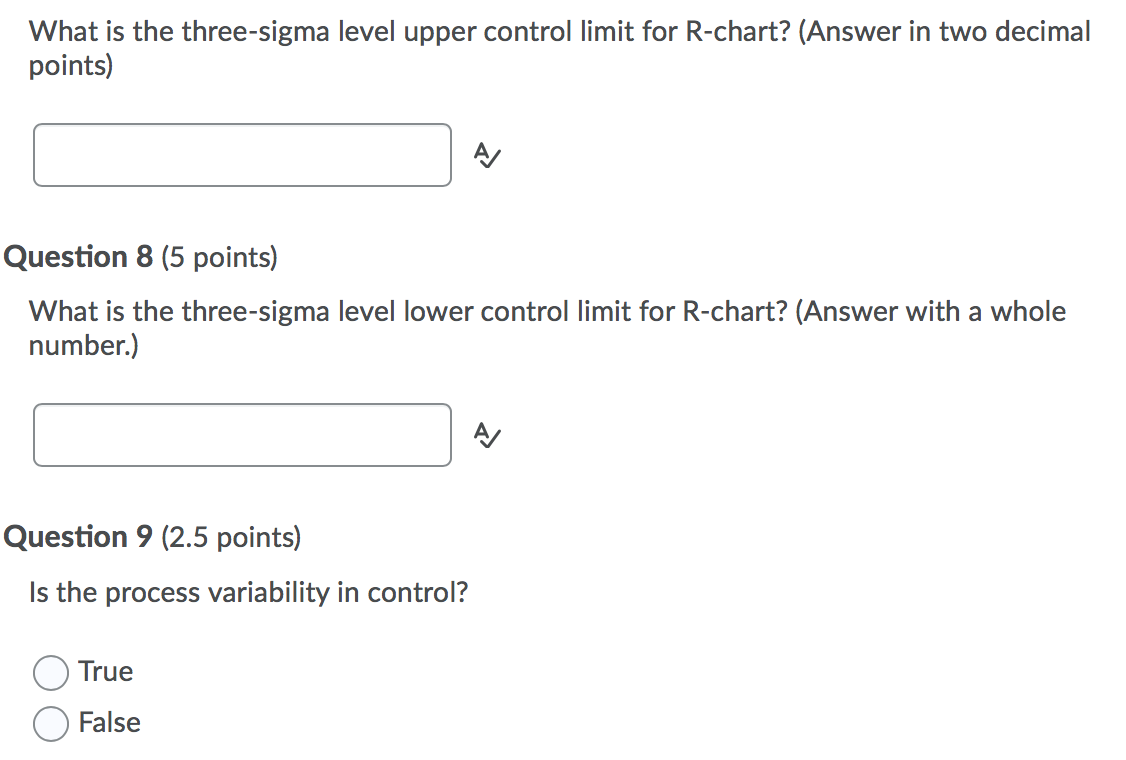
A quality analyst wants to construct a control chart for determining whether three machines, all producing the same product, are in control with regard to a particular quality variable. Accordingly, he sampled four units of output from each machine, with the following results: Machine #1 15 17 17 16 23 15 18 #2 25 25 #3 24 23 22 Using the above data and the factor table below, please answer the following questions. Size of Sample (n) Factor for UCL and LCL for X-Chart (A) Factor for LCL for R-Chart (D2) Factor for UCL for R-Chart (D) 1.880 0 3.267 1.023 2.575 0.729 2.282 0.577 2.115 0.483 2.004 0.419 0.076 1.924 0.373 0.136 1.864 0.337 0.184 1.816 10 0.308 0.223 1.777 Source: Reprinted with permission from ASTM Manual on Quality Control of Materials, copyright ASTM International, 100 Barr Harbor Drive, West Conshohocken, PA 19428. Question 6 (5 points) What is the estimate of the sample average range based upon this limited sample? What is the three-sigma level upper control limit for R-chart? (Answer in two decimal points) Question 8 (5 points) What is the three-sigma level lower control limit for R-chart? (Answer with a whole number.) Question 9 (2.5 points) Is the process variability in control? O True O False A quality analyst wants to construct a control chart for determining whether three machines, all producing the same product, are in control with regard to a particular quality variable. Accordingly, he sampled four units of output from each machine, with the following results: Machine #1 15 17 17 16 23 15 18 #2 25 25 #3 24 23 22 Using the above data and the factor table below, please answer the following questions. Size of Sample (n) Factor for UCL and LCL for X-Chart (A) Factor for LCL for R-Chart (D2) Factor for UCL for R-Chart (D) 1.880 0 3.267 1.023 2.575 0.729 2.282 0.577 2.115 0.483 2.004 0.419 0.076 1.924 0.373 0.136 1.864 0.337 0.184 1.816 10 0.308 0.223 1.777 Source: Reprinted with permission from ASTM Manual on Quality Control of Materials, copyright ASTM International, 100 Barr Harbor Drive, West Conshohocken, PA 19428. Question 6 (5 points) What is the estimate of the sample average range based upon this limited sample? What is the three-sigma level upper control limit for R-chart? (Answer in two decimal points) Question 8 (5 points) What is the three-sigma level lower control limit for R-chart? (Answer with a whole number.) Question 9 (2.5 points) Is the process variability in control? O True O False


