

Question: Please answer as soon as possible 1. Project B data: Task Duration Predecessors $Budget Status at the end of Day (days) 25 C 10 Start
Please answer as soon as possible
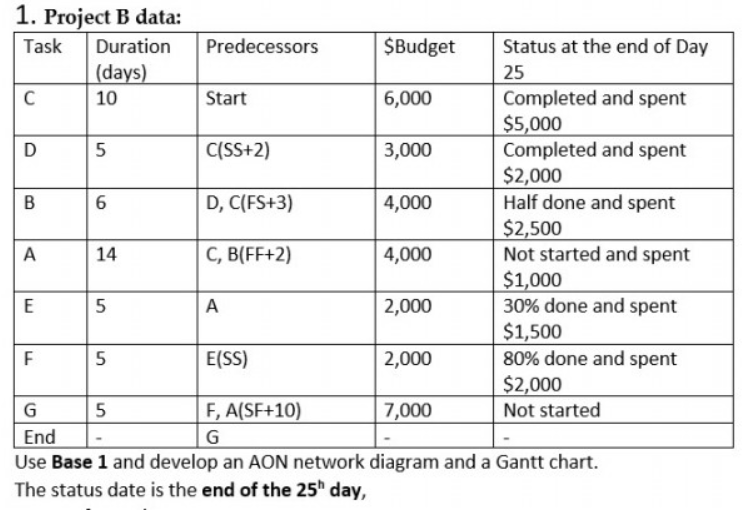
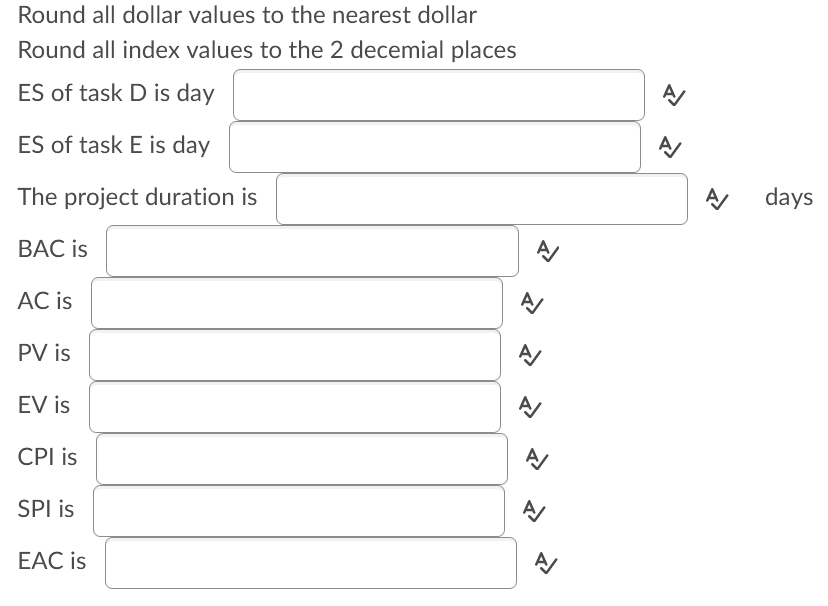
1. Project B data: Task Duration Predecessors $Budget Status at the end of Day (days) 25 C 10 Start 6,000 Completed and spent $5,000 D 5 C(SS+2) 3,000 Completed and spent $2,000 B 6 D, C(FS+3) 4,000 Half done and spent $2,500 A 14 C, B(FF+2) 4,000 Not started and spent $1,000 E 5 A 2,000 30% done and spent $1,500 F 5 E(SS) 2,000 80% done and spent $2,000 G 5 F, A(SF+10) 7,000 Not started End G Use Base 1 and develop an AON network diagram and a Gantt chart. The status date is the end of the 25" day,Round all dollar values to the nearest dollar Round all index values to the 2 decemial places E8 of task D is day E8 of task E is day
Step by Step Solution
There are 3 Steps involved in it

Get step-by-step solutions from verified subject matter experts