

Question: Figure Q1.1 below shows a diagram of a proposed sewer network. The pipe slope and proposed diameter is also shown. Use the attached HRS
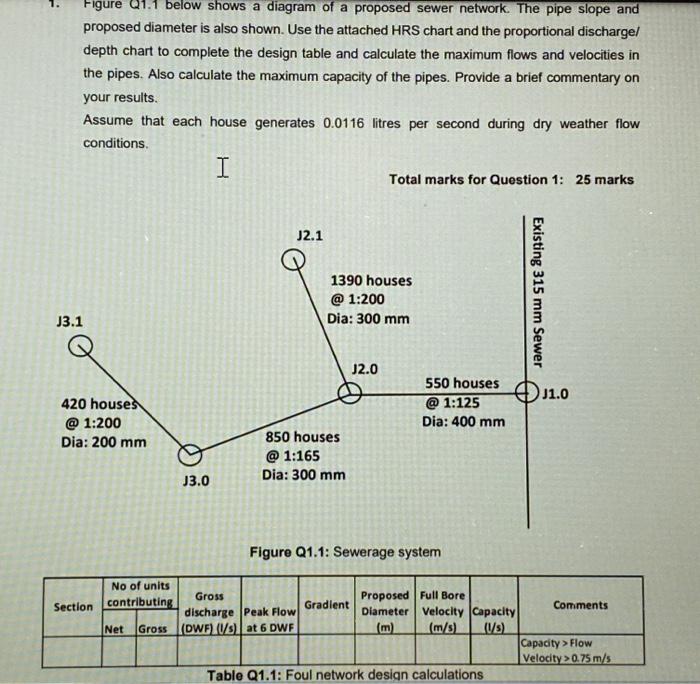
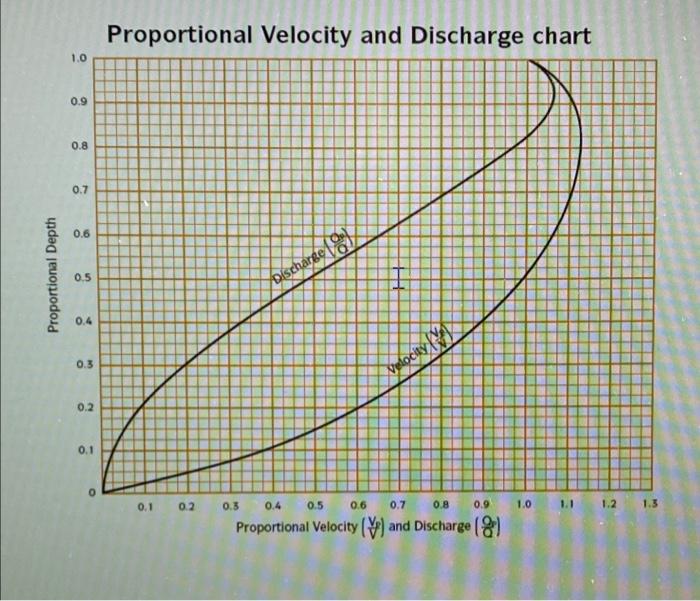
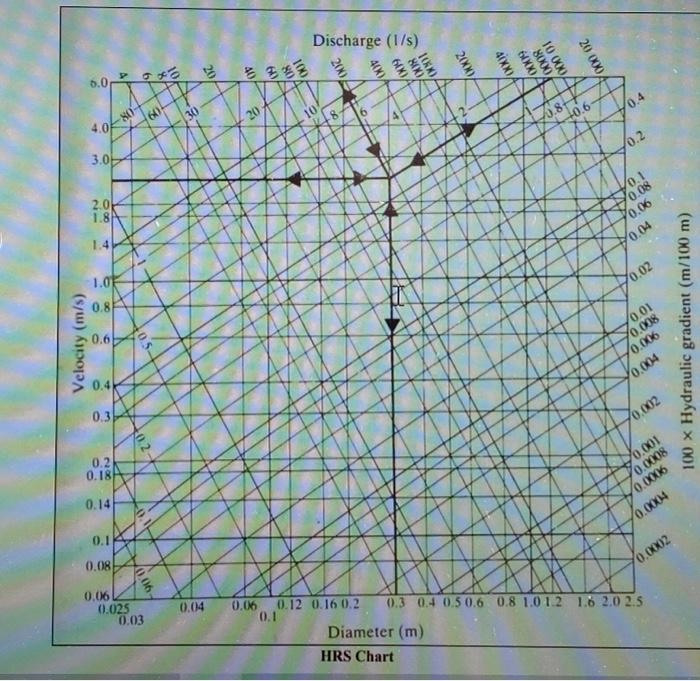
Figure Q1.1 below shows a diagram of a proposed sewer network. The pipe slope and proposed diameter is also shown. Use the attached HRS chart and the proportional discharge/ depth chart to complete the design table and calculate the maximum flows and velocities in the pipes. Also calculate the maximum capacity of the pipes. Provide a brief commentary on your results. Assume that each house generates 0.0116 litres per second during dry weather flow conditions. I J3.1 420 houses @1:200 Dia: 200 mm Section No of units contributing J3.0 J2.1 850 houses @1:165 Dia: 300 mm Gross discharge Peak Flow Net Gross (DWF) (/s) at 6 DWF 1390 houses @ 1:200 Dia: 300 mm Total marks for Question 1: 25 marks J2.0 Gradient 550 houses Figure Q1.1: Sewerage system @1:125 Dia: 400 mm Proposed Full Bore Diameter Velocity Capacity (m/s) (1/s) Table Q1.1: Foul network design calculations Existing 315 mm Sewer 11.0 Comments Capacity > Flow Velocity >0.75 m/s Proportional Depth 1.0 0.9 0.8 0.7 0.6 0.5 0.4 0.3 0.2 0.1 Proportional Velocity and Discharge chart harge (8) 0.1 0.2 0.3 Discharge Velocity ( 0.4 0.5 0.6 0.7 0.8 Proportional Velocity (V) and Discharge (8) 0.9 1.0 1.1 1.2 1.3 Velocity (m/s) 6.0 4.0 3.0 2.0 1.8 21 1.0 0.8 0.6 0.4) 0.3 0.2 0.18 0.14 0.1 0.08 80- 0.2. 0 0.06 0.06 0.025 0.03 60 30 20 0.04 a 0.06 Discharge (1/s) 0.1 2000 0.12 0.16 0.2 400A 600A 800 2000/ Diameter (m) HRS Chart 40XX0A 6000 8000 10 000 0.8 20 000 +0.6- /0.4 0.2 0.1 0.08 0.06 0.04 70.02 0.01 0.008 0.006 0.004 0.002 0.001 0.0008 o 0.0006 0.0004 70,0002 0.3 0.4 0.5 0.6 0.8 1.0 1.2 1.6 2.0 2.5 100 x Hydraulic gradient (m/100 m)
Step by Step Solution
There are 3 Steps involved in it
The skin friction coefficient Cf for a laminar boundary ... View full answer

Get step-by-step solutions from verified subject matter experts