

Question: Please answer Case 6.3 only with EXCEL AND SOLVER SCREENSHOTS INCLUDING SCREENSHOTS OF CELL FORMULAS, if any. Please explain answers. Case 4.3 and solution to
Please answer Case 6.3 only with EXCEL AND SOLVER SCREENSHOTS INCLUDING SCREENSHOTS OF CELL FORMULAS, if any. Please explain answers. Case 4.3 and solution to parts a) and b) of Case 4.3 provided for reference only.
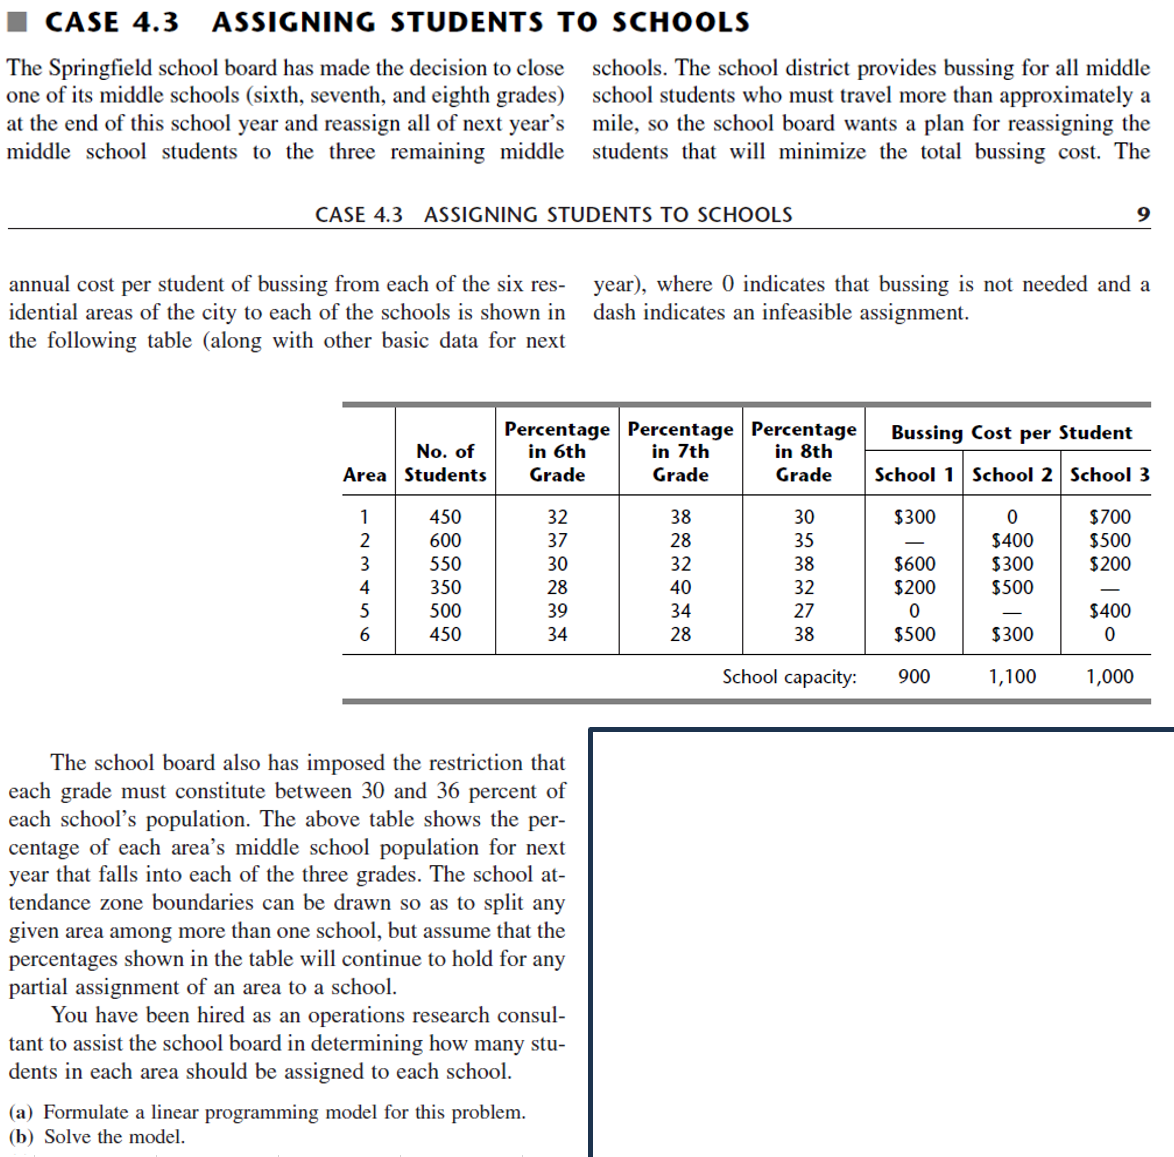
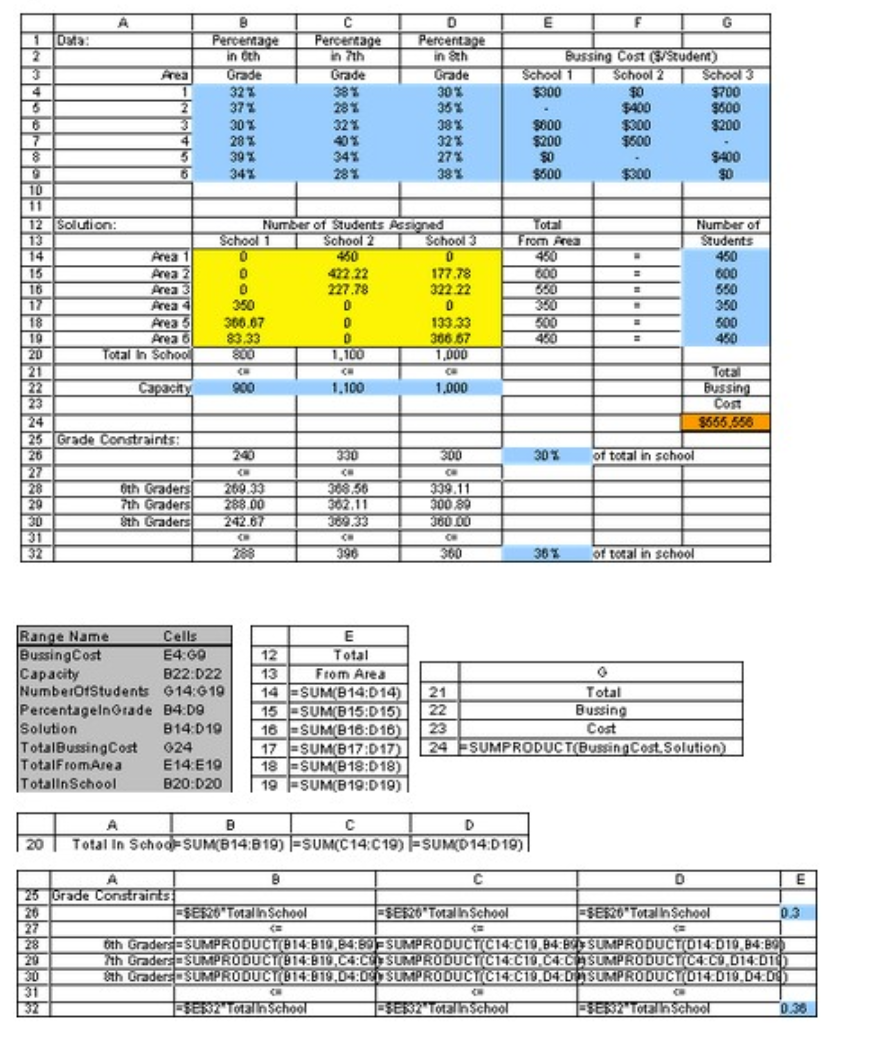
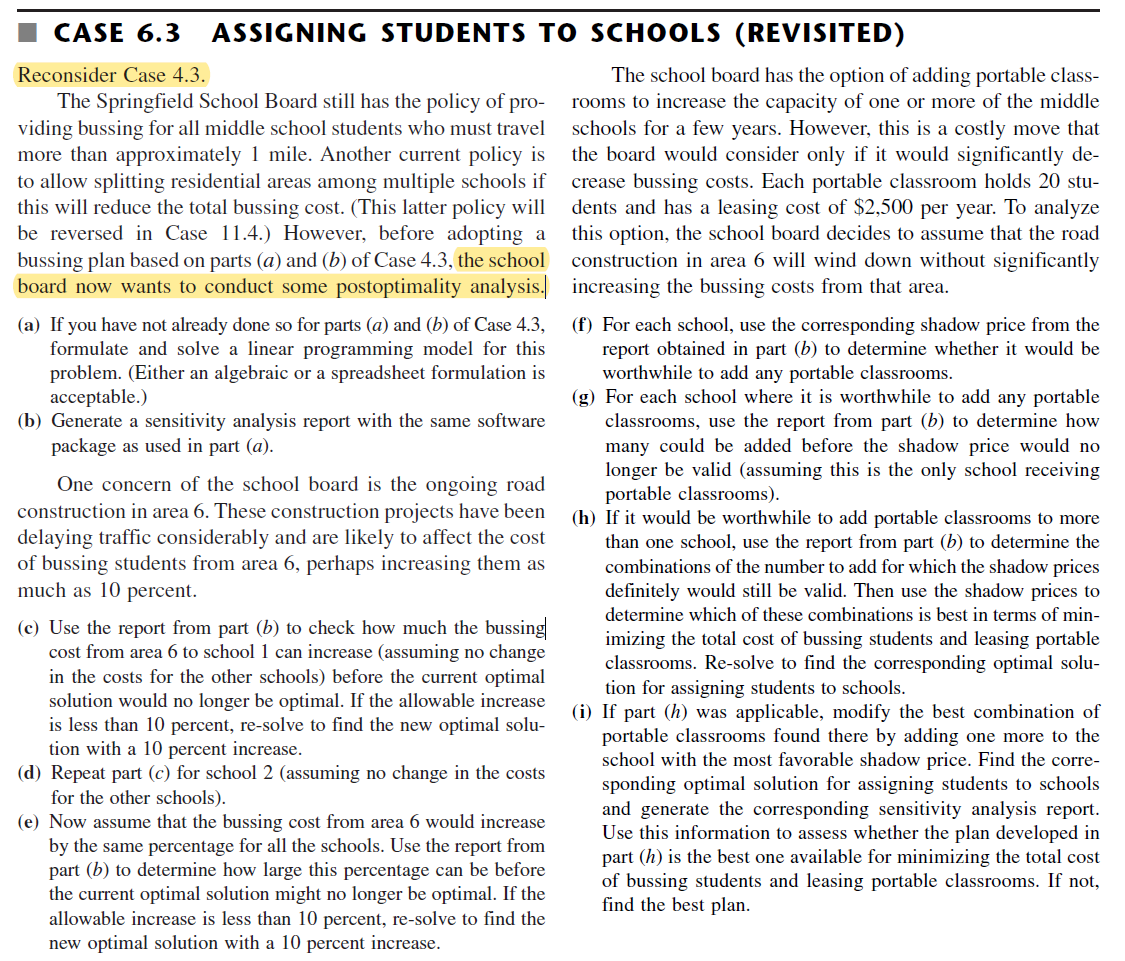
CASE 4.3 ASSIGNING STUDENTS TO SCHOOLS The Springfield school board has made the decision to close one of its middle schools (sixth, seventh, and eighth grades) at the end of this school year and reassign all of next year's middle school students to the three remaining middle schools. The school district provides bussing for all middle school students who must travel more than approximately a mile, so the school board wants a plan for reassigning the students that will minimize the total bussing cost. The CASE 4.3 ASSIGNING STUDENTS TO SCHOOLS 9 annual cost per student of bussing from each of the six residential areas of the city to each of the schools is shown in the following table (along with other basic data for next year), where 0 indicates that bussing is not needed and a dash indicates an infeasible assignment. The school board also has imposed the restriction that each grade must constitute between 30 and 36 percent of each school's population. The above table shows the percentage of each area's middle school population for next year that falls into each of the three grades. The school attendance zone boundaries can be drawn so as to split any given area among more than one school, but assume that the percentages shown in the table will continue to hold for any partial assignment of an area to a school. You have been hired as an operations research consultant to assist the school board in determining how many students in each area should be assigned to each school. (a) Formulate a linear programming model for this problem. (b) Solve the model. CASE 6.3 ASSIGNING STUDENTS TO SCHOOLS (REVISITED) Reconsider Case 4.3. The Springfield School Board still has the policy of providing bussing for all middle school students who must travel more than approximately 1 mile. Another current policy is to allow splitting residential areas among multiple schools if this will reduce the total bussing cost. (This latter policy will be reversed in Case 11.4.) However, before adopting a bussing plan based on parts ( a ) and (b) of Case 4.3 , the school board now wants to conduct some postoptimality analysis.| (a) If you have not already done so for parts (a) and (b) of Case 4.3, formulate and solve a linear programming model for this problem. (Either an algebraic or a spreadsheet formulation is acceptable.) (b) Generate a sensitivity analysis report with the same software package as used in part (a). One concern of the school board is the ongoing road construction in area 6 . These construction projects have been delaying traffic considerably and are likely to affect the cost of bussing students from area 6 , perhaps increasing them as much as 10 percent. (c) Use the report from part (b) to check how much the bussing cost from area 6 to school 1 can increase (assuming no change in the costs for the other schools) before the current optimal solution would no longer be optimal. If the allowable increase is less than 10 percent, re-solve to find the new optimal solution with a 10 percent increase. (d) Repeat part (c) for school 2 (assuming no change in the costs for the other schools). (e) Now assume that the bussing cost from area 6 would increase by the same percentage for all the schools. Use the report from part (b) to determine how large this percentage can be before the current optimal solution might no longer be optimal. If the allowable increase is less than 10 percent, re-solve to find the new optimal solution with a 10 percent increase. The school board has the option of adding portable classrooms to increase the capacity of one or more of the middle schools for a few years. However, this is a costly move that the board would consider only if it would significantly decrease bussing costs. Each portable classroom holds 20 students and has a leasing cost of $2,500 per year. To analyze this option, the school board decides to assume that the road construction in area 6 will wind down without significantly increasing the bussing costs from that area. (f) For each school, use the corresponding shadow price from the report obtained in part (b) to determine whether it would be worthwhile to add any portable classrooms. (g) For each school where it is worthwhile to add any portable classrooms, use the report from part (b) to determine how many could be added before the shadow price would no longer be valid (assuming this is the only school receiving portable classrooms). (h) If it would be worthwhile to add portable classrooms to more than one school, use the report from part (b) to determine the combinations of the number to add for which the shadow prices definitely would still be valid. Then use the shadow prices to determine which of these combinations is best in terms of minimizing the total cost of bussing students and leasing portable classrooms. Re-solve to find the corresponding optimal solution for assigning students to schools. (i) If part (h) was applicable, modify the best combination of portable classrooms found there by adding one more to the school with the most favorable shadow price. Find the corresponding optimal solution for assigning students to schools and generate the corresponding sensitivity analysis report. Use this information to assess whether the plan developed in part (h) is the best one available for minimizing the total cost of bussing students and leasing portable classrooms. If not, find the best plan. \begin{tabular}{|c|c|c|c|c|} \hline & A & B & C & D \\ \hline 20 & Total In Schod) SUM(B14:B19) & =SUM(C14:C19) & =SUM(D14:D 19) \\ \hline \end{tabular}
Step by Step Solution
There are 3 Steps involved in it

Get step-by-step solutions from verified subject matter experts