

Question: please answer me my all simulation questions lab as soon as possible ,and thank u Open the LabVIEW then click on create project then choose
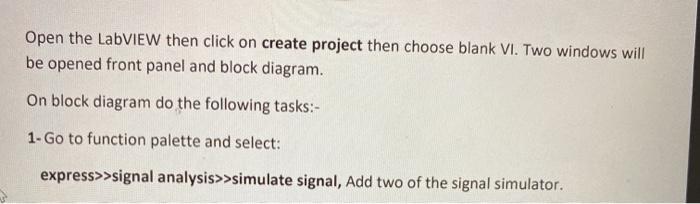
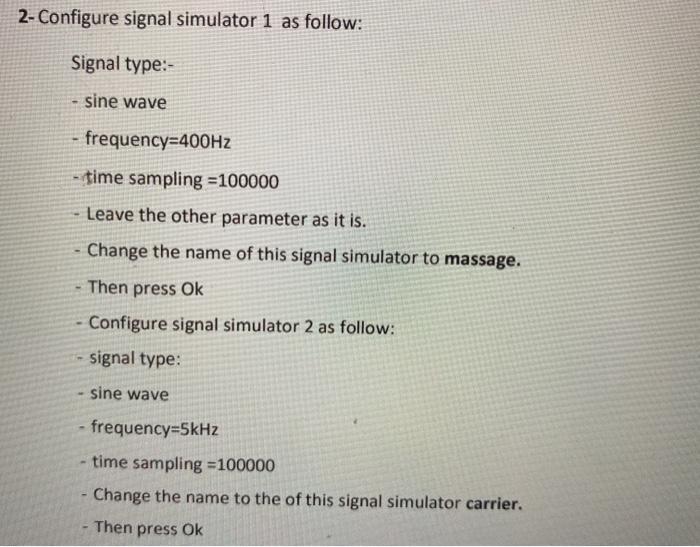
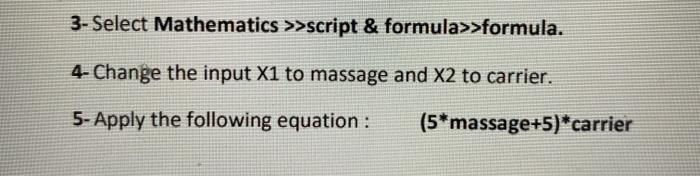
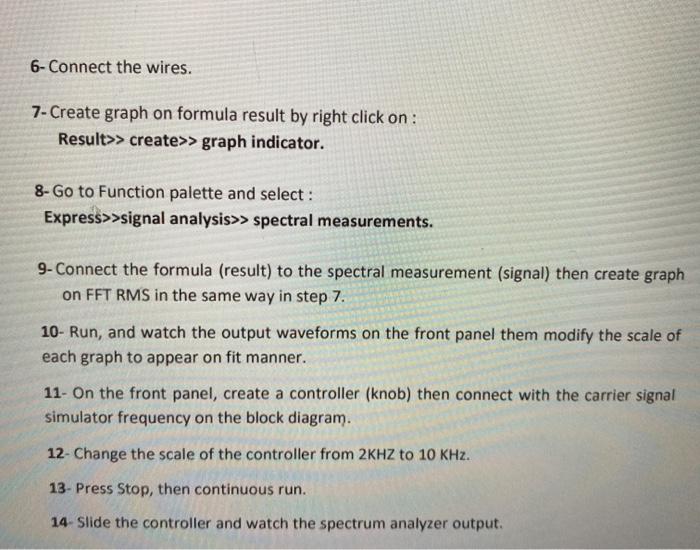
Open the LabVIEW then click on create project then choose blank VI. Two windows will be opened front panel and block diagram. On block diagram do the following tasks:- 1. Go to function palette and select: express>>signal analysis>>simulate signal, Add two of the signal simulator. 2- Configure signal simulator 1 as follow: Signal type: sine wave - frequency=400Hz - time sampling =100000 Leave the other parameter as it is. Change the name of this signal simulator to massage. Then press Ok Configure signal simulator 2 as follow: signal type: sine wave - frequency=5kHz time sampling =100000 Change the name to the of this signal simulator carrier. Then press Ok 3- Select Mathematics >>script & formula>>formula. 4- Change the input X1 to massage and X2 to carrier. 5- Apply the following equation : (5*massage+5)*carrier 6- Connect the wires. 7- Create graph on formula result by right click on : Result>> create>> graph indicator. 8- Go to Function palette and select : Express>>signal analysis>> spectral measurements. 9- Connect the formula (result) to the spectral measurement (signal) then create graph on FFT RMS in the same way in step 7. 10- Run, and watch the output waveforms on the front panel them modify the scale of each graph to appear on fit manner. 11- On the front panel, create a controller (knob) then connect with the carrier signal simulator frequency on the block diagram. 12- Change the scale of the controller from 2KHZ to 10 KHz. 13- Press Stop, then continuous run. 14- Slide the controller and watch the spectrum analyzer output. Homework (Amplitude Demodulation) **Simulate the demodulation as in experiment (6) with filtering using LABVIEW. 108
Step by Step Solution
There are 3 Steps involved in it

Get step-by-step solutions from verified subject matter experts