

Question: Please answer question 5-8 and provide all the work and answers on a separate document that will easily help me to understand how the problem
Please answer question 5-8 and provide all the work and answers on a separate document that will easily help me to understand how the problem was solved. Thank you!
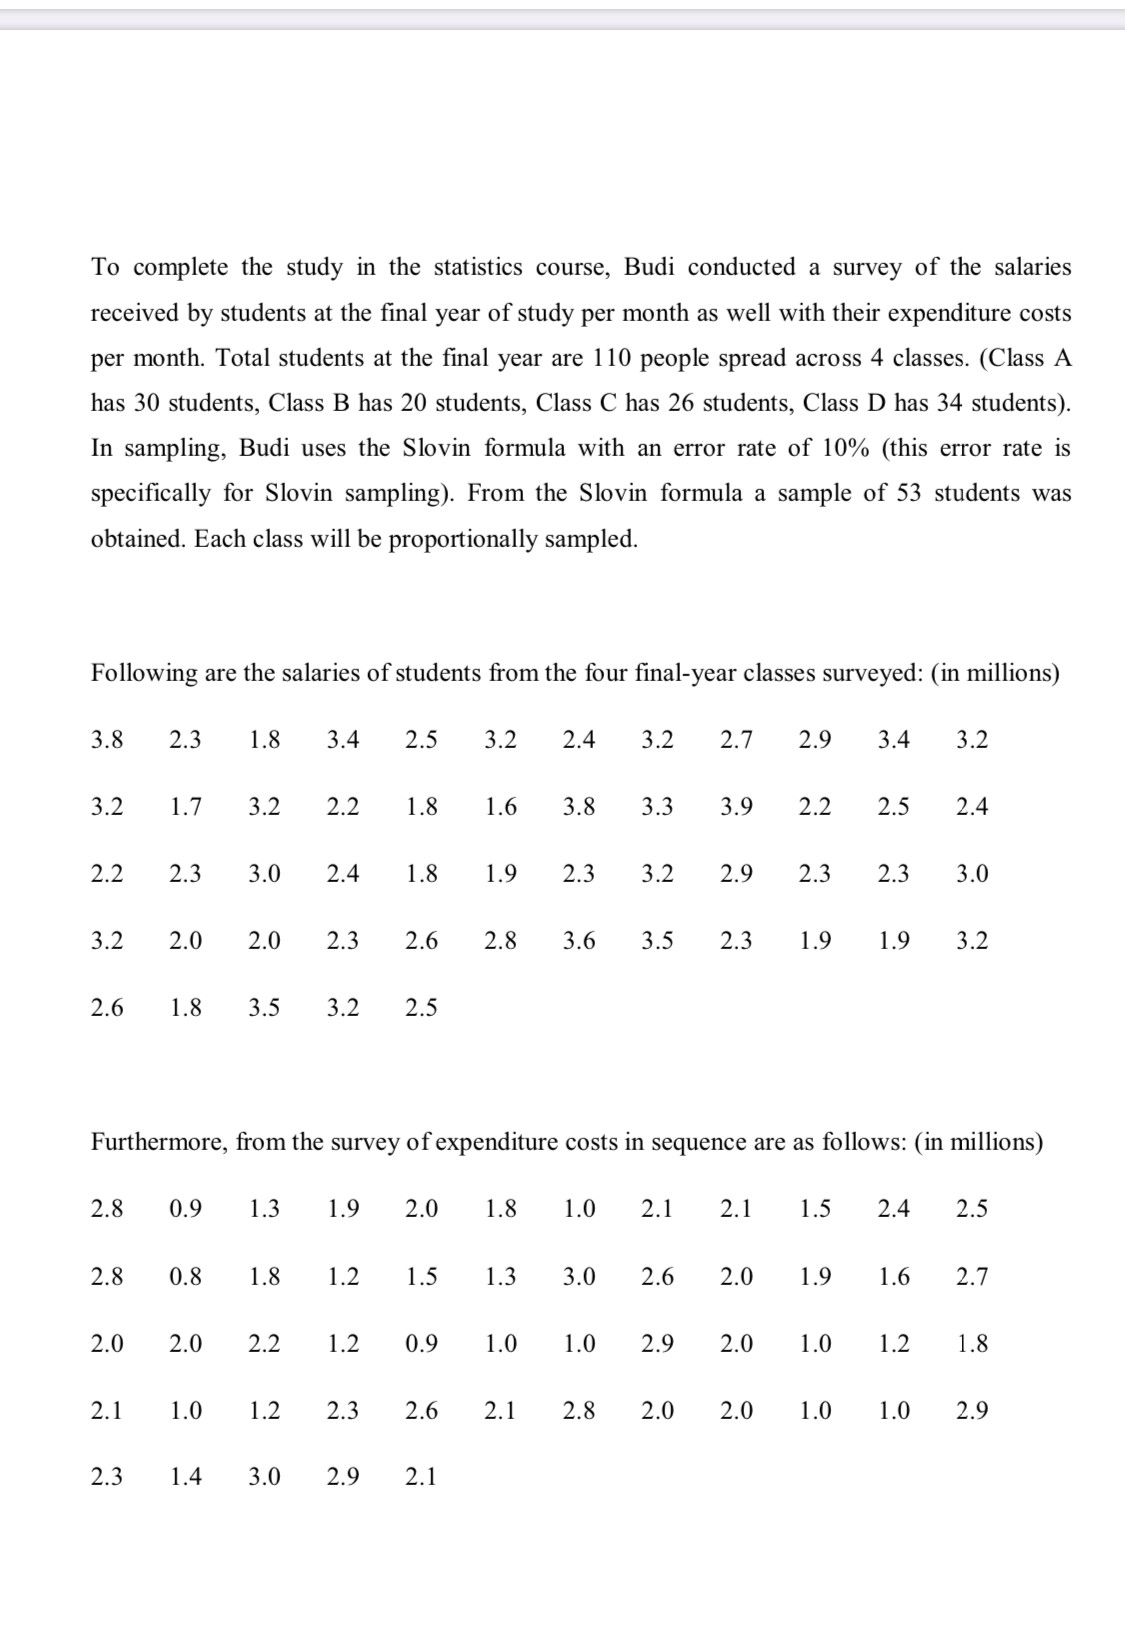
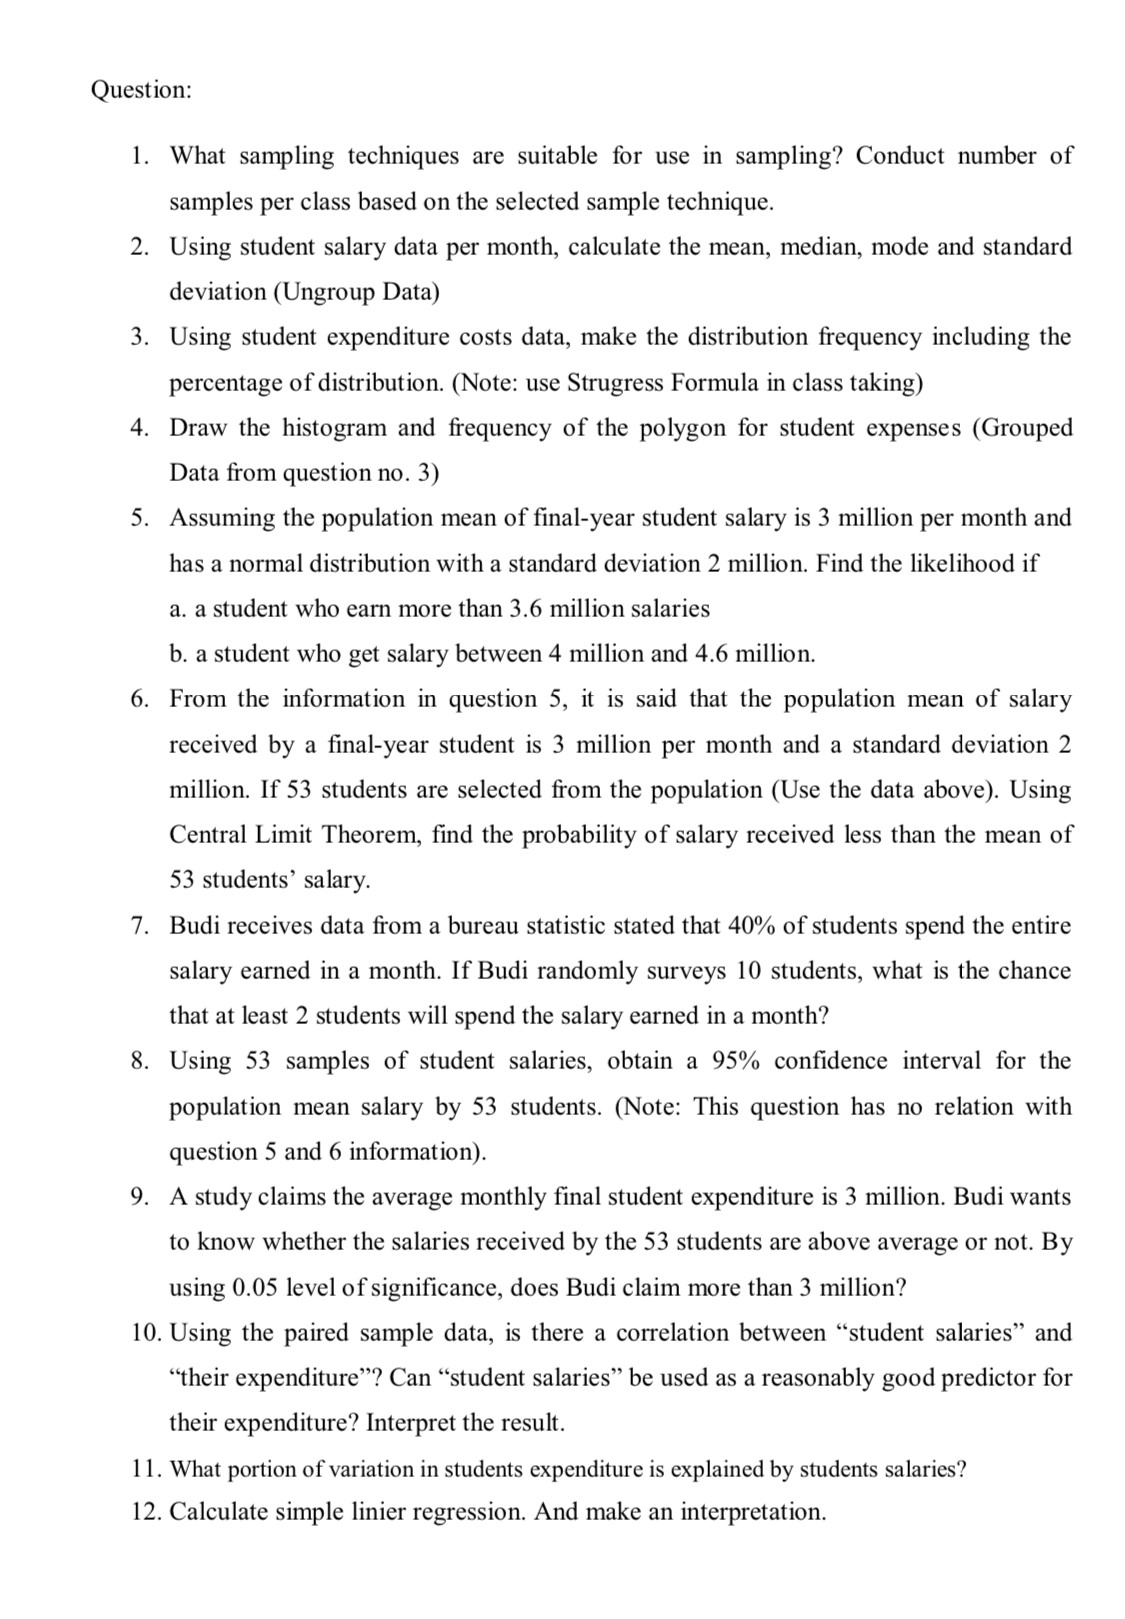
To complete the study in the statistics course, Budi conducted a survey of the salaries received by students at the final year of study per month as well with their expenditure costs per month. Total students at the nal year are 110 people spread across 4 classes. (Class A has 30 students, Class B has 20 students, Class C has 26 students, Class D has 34 students). In sampling, Budi uses the Slovin formula with an error rate of 10% (this error rate is specically for Slovin sampling). From the Slovin formula a sample of 53 students was obtained. Each class will be proportionally sampled. Following are the salaries of students from the four nal-year classes surveyed: (in millions) 3.8 2.3 1.8 3.4 2.5 3.2 2.4 3.2 2.7 2.9 3.4 3.2 3.2 1.7 3.2 2.2 1.8 1.6 3.8 3.3 3.9 2.2 2.5 2.4 2.2 2.3 3.0 2.4 1.8 1.9 2.3 3.2 2.9 2.3 2.3 3.0 3.2 2.0 2.0 2.3 2.6 2.8 3.6 3.5 2.3 1.9 1.9 3.2 2.6 1.8 3.5 3.2 2.5 Furthermore, from the survey of expenditure costs in sequence are as follows: (in millions) 2.8 0.9 1.3 1.9 2.0 1.8 1.0 2.1 2.1 1.5 2.4 2.5 2.8 0.8 1.8 1.2 1.5 1.3 3.0 2.6 2.0 1.9 1.6 2.7 2.0 2.0 2.2 1.2 0.9 1.0 1.0 2.9 2.0 1.0 1.2 1.8 2.1 1.0 1.2 2.3 2.6 2.1 2.8 2.0 2.0 1.0 1.0 2.9 2.3 1.4 3.0 2.9 2.1 Quest ion: 1. 10. ll. 12. What sampling techniques are suitable for use in sampling? Conduct number of samples per class based on the selected sample technique. Using student salary data per month, calculate the mean, median, mode and standard deviation (Ungroup Data) Using student expenditure costs data, make the distribution equency including the percentage of distribution. (Note: use Strugress Formula in class taking) Draw the histogram and 'equency of the polygon for student expenses (Grouped Data 'om question no. 3) Assuming the population mean of nal-year student salary is 3 million per month and has a normal distribution with a standard deviation 2 million. Find the likelihood if a. a student who earn more than 3.6 million salaries b. a student who get salary between 4 million and 4.6 million. From the information in question 5, it is said that the population mean of salary received by a nal-year student is 3 million per month and a standard deviation 2 million. If 53 students are selected om the population (Use the data above). Using Central Limit Theorem, nd the probability of salary received less than the mean of 53 students' salary. Budi receives data from a bureau statistic stated that 40% of students spend the entire salary earned in a month. If Budi randomly surveys 10 students, what is the chance that at least 2 students will spend the salary earned in a month? Using 53 samples of student salaries, obtain a 95% condence interval for the population mean salary by 53 students. (Note: This question has no relation with question 5 and 6 information). A study claims the average monthly nal student expenditure is 3 million. Budi wants to know whether the salaries received by the 53 students are above average or not. By using 0.05 level of signicance, does Budi claim more than 3 million? Using the paired sample data, is there a correlation between \"student salaries\" and \"their expenditure\"? Can \"student salaries\" be used as a reasonably good predictor for their expenditure? Interpret the result. What portion of variation in students expenditure is explained by students salaries? Calculate simple linier regression. And make an interpretation
Step by Step Solution
There are 3 Steps involved in it

Get step-by-step solutions from verified subject matter experts