

Question: PLEASE answer question A and B in Microsoft Excel and SHOW FORMULAS in cells. Thank you! Problem #3 There is substantial cross-sectional variation in the
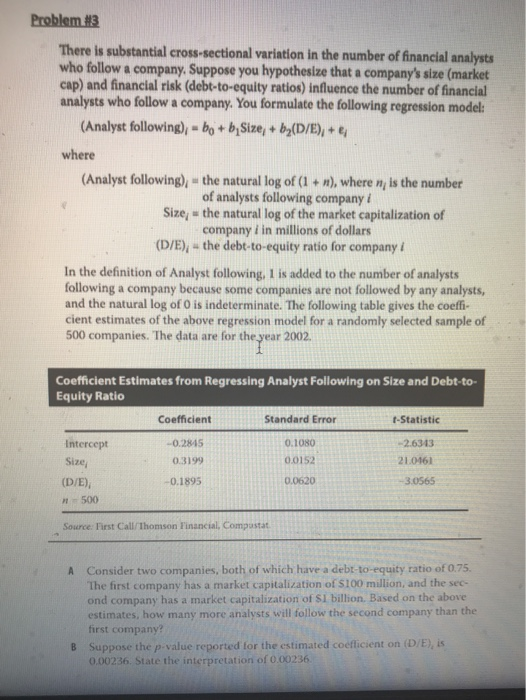
Problem #3 There is substantial cross-sectional variation in the number of financial analysts who follow a company. Suppose you hypothesize that a company's size (market cap) and financial risk (debt-to-equity ratios) influence the number of financial analysts who follow a company. You formulate the following regression model: (Analyst following), - b + by Size + by(D/E), + where (Analyst following), the natural log of (1 + r), where is the number of analysts following company i Size; - the natural log of the market capitalization of company i in millions of dollars (D/E), - the debt-to-equity ratio for company i In the definition of Analyst following. 1 is added to the number of analysts following a company because some companies are not followed by any analysts, and the natural log of O is indeterminate. The following table gives the coeffi- cient estimates of the above regression model for a randomly selected sample of 500 companies. The data are for the year 2002. Coefficient Estimates from Regressing Analyst Following on Size and Debt-to Equity Ratio Coefficient Standard Error -Statistic -0.2845 0.3199 -0.1895 0.1080 0.0152 Intercept Size (D/E), -500 -2.6313 21.0161 0.0620 -3.0565 Source: First Call/Thomson Financial, Computat A Consider two companies, both of which have a debt-to-equity ratio of 0.75. The first company has a market capitalization of S100 million, and the sec- ond company has a market capitalization of S1 billion. Based on the above estimates, how many more analysts will follow the second company than the first company? Suppose the p-value reported for the estimated coefficient on (D/E), 0.00236. State the interpretation of 0.00236 B
Step by Step Solution
There are 3 Steps involved in it

Get step-by-step solutions from verified subject matter experts