

Question: please show all the calculation to both question 3 and 8, they are little bit related. 3. There is substantial cross-sectional variation in the number
please show all the calculation to both question 3 and 8, they are little bit related.
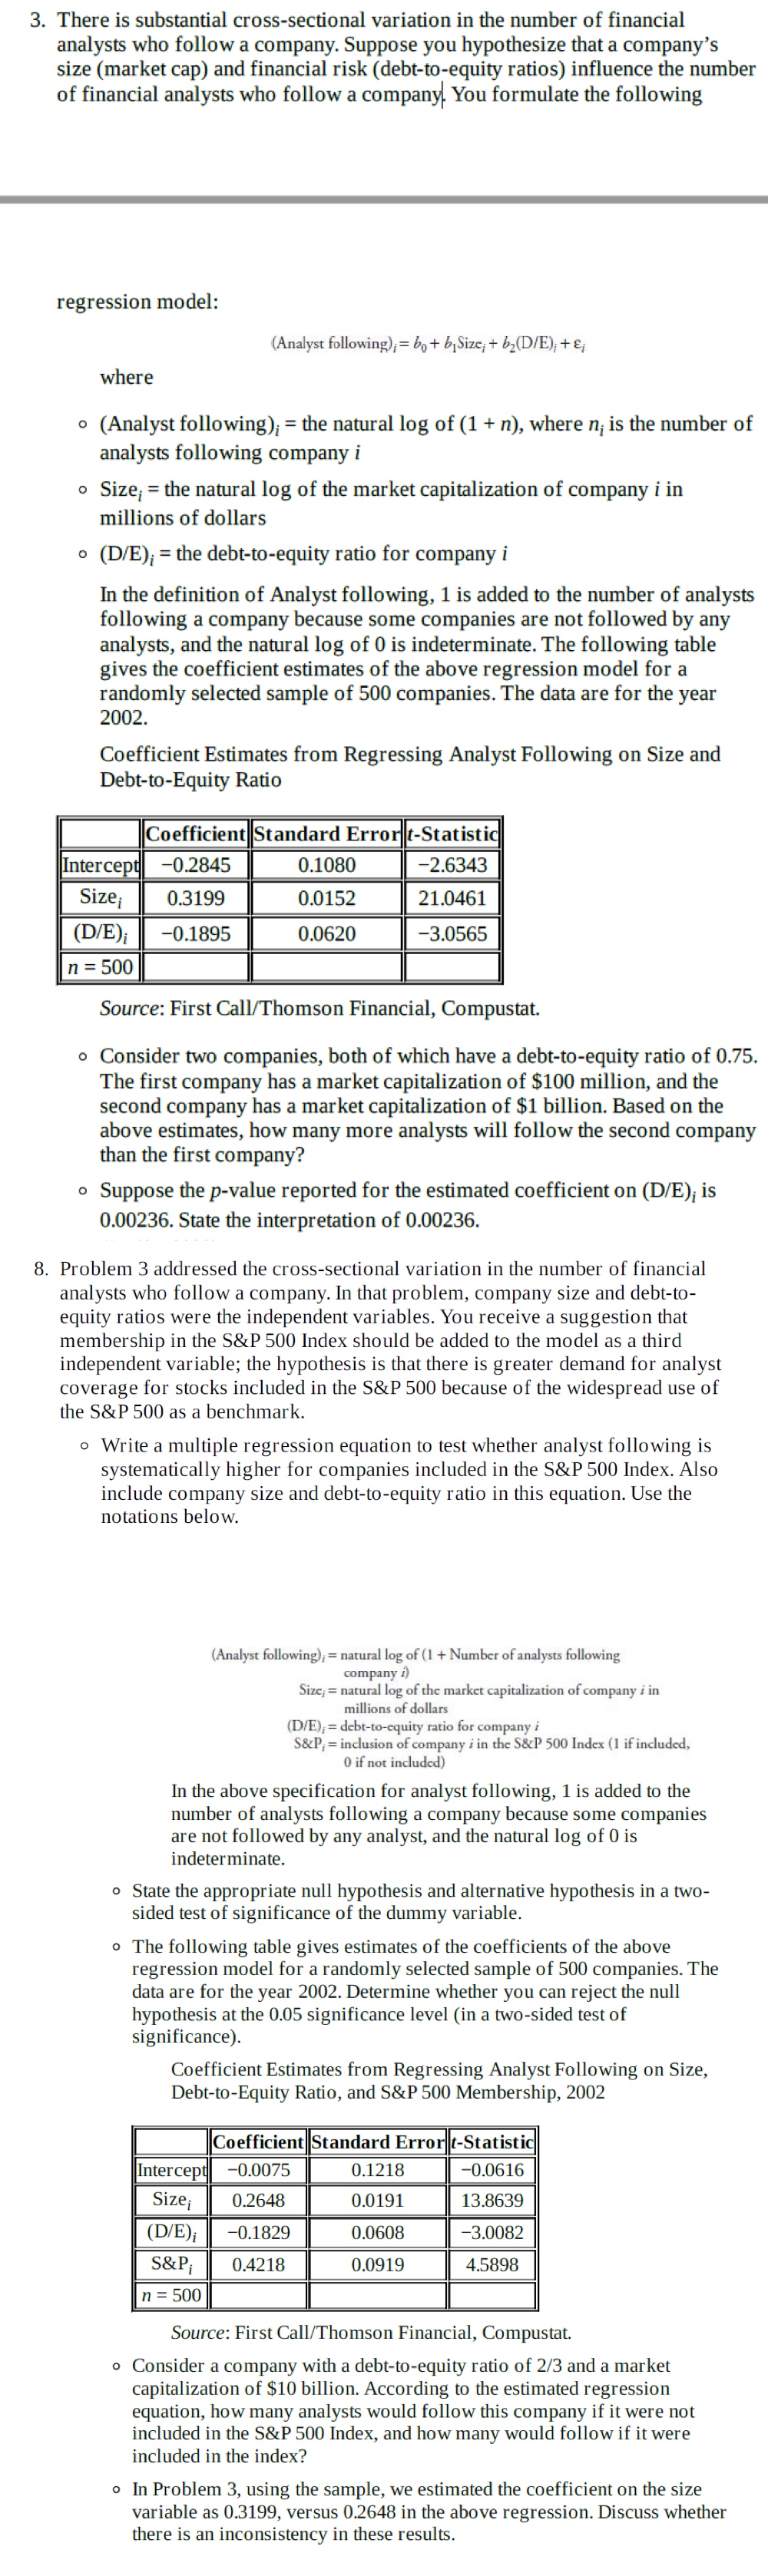
3. There is substantial cross-sectional variation in the number of financial analysts who follow a company. Suppose you hypothesize that a company's size (market cap) and financial risk (debt-to-equity ratios) influence the number of financial analysts who follow a company You formulate the following regression model: (Analyst following); = bo + b,Size, + 62(D/E), + &; where . (Analyst following); = the natural log of (1 + n), where n; is the number of analysts following company i . Size; = the natural log of the market capitalization of company i in millions of dollars . (D/E); = the debt-to-equity ratio for company i In the definition of Analyst following, 1 is added to the number of analysts following a company because some companies are not followed by any analysts, and the natural log of 0 is indeterminate. The following table gives the coefficient estimates of the above regression model for a randomly selected sample of 500 companies. The data are for the year 2002. Coefficient Estimates from Regressing Analyst Following on Size and Debt-to-Equity Ratio Coefficient Standard Errorat-Statistic Intercept -0.2845 0.1080 -2.6343 Size 0.3199 0.0152 21.0461 (D/E); -0.1895 0.0620 -3.0565 n = 500 Source: First Call/Thomson Financial, Compustat. . Consider two companies, both of which have a debt-to-equity ratio of 0.75. The first company has a market capitalization of $100 million, and the second company has a market capitalization of $1 billion. Based on the above estimates, how many more analysts will follow the second company than the first company? . Suppose the p-value reported for the estimated coefficient on (D/E); is 0.00236. State the interpretation of 0.00236. 8. Problem 3 addressed the cross-sectional variation in the number of financial analysts who follow a company. In that problem, company size and debt-to- equity ratios were the independent variables. You receive a suggestion that membership in the S&P 500 Index should be added to the model as a third independent variable; the hypothesis is that there is greater demand for analyst coverage for stocks included in the S&P 500 because of the widespread use of the S&P 500 as a benchmark. . Write a multiple regression equation to test whether analyst following is systematically higher for companies included in the S&P 500 Index. Also include company size and debt-to-equity ratio in this equation. Use the notations below. (Analyst following); = natural log of (1 + Number of analysts following company i) Size, = natural log of the market capitalization of company i in millions of dollars (D/E); = debt-to-equity ratio for company S&P, = inclusion of company i in the S&P 500 Index (1 if included, 0 if not included) In the above specification for analyst following, 1 is added to the number of analysts following a company because some companies are not followed by any analyst, and the natural log of 0 is indeterminate. . State the appropriate null hypothesis and alternative hypothesis in a two- sided test of significance of the dummy variable. o The following table gives estimates of the coefficients of the above regression model for a randomly selected sample of 500 companies. The data are for the year 2002. Determine whether you can reject the null hypothesis at the 0.05 significance level (in a two-sided test of significance). Coefficient Estimates from Regressing Analyst Following on Size, Debt-to-Equity Ratio, and S&P 500 Membership, 2002 Coefficient Standard Error t-Statistic Intercept -0.0075 0.1218 -0.0616 Size 0.2648 0.0191 13.8639 (D/E); -0.1829 0.0608 -3.0082 S&P; 0.4218 0.0919 4.5898 n = 500 Source: First Call/Thomson Financial, Compustat. Consider a company with a debt-to-equity ratio of 2/3 and a market capitalization of $10 billion. According to the estimated regression equation, how many analysts would follow this company if it were not included in the S&P 500 Index, and how many would follow if it were included in the index? o In Problem 3, using the sample, we estimated the coefficient on the size variable as 0.3199, versus 0.2648 in the above regression. Discuss whether there is an inconsistency in these results
Step by Step Solution
There are 3 Steps involved in it

Get step-by-step solutions from verified subject matter experts