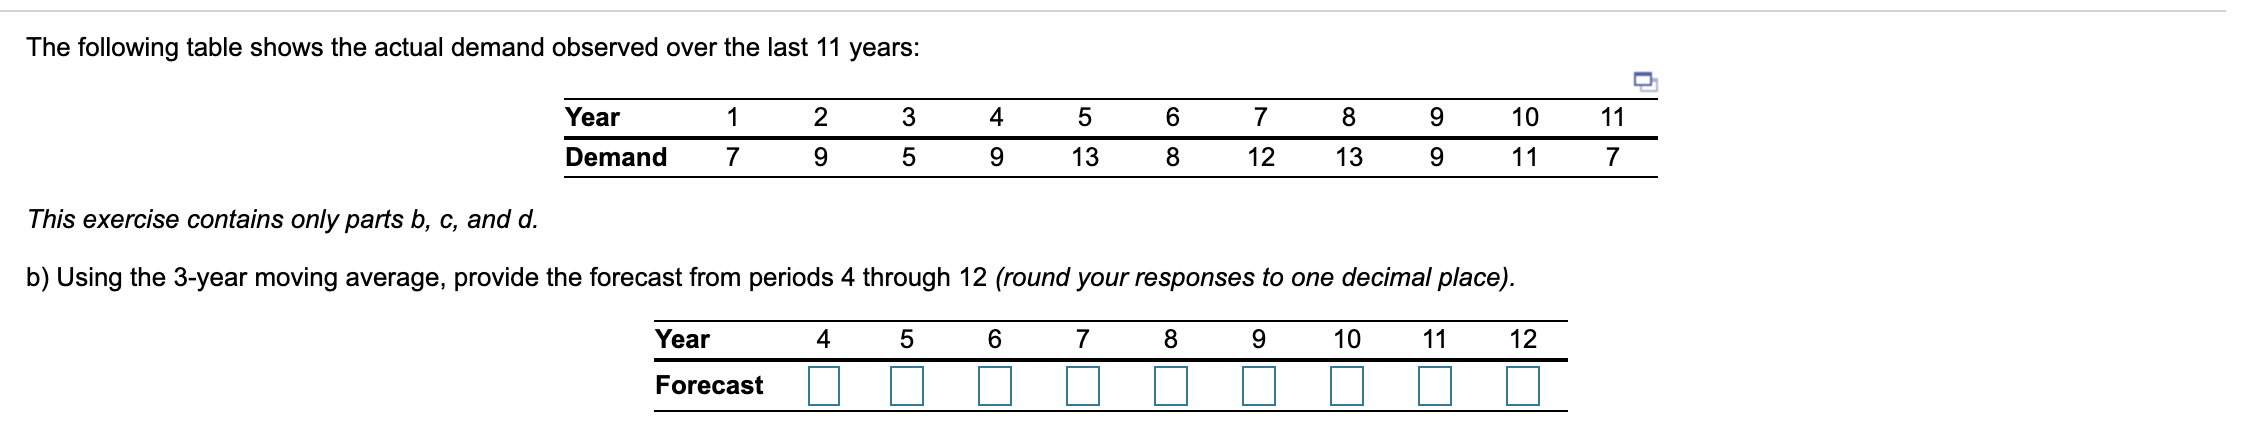
Question: PLEASE ANSWER QUICKLY, AS THERE IS LIMITED TIME! The following table shows the actual demand observed over the last 11 years: Year 1 2 3

PLEASE ANSWER QUICKLY, AS THERE IS LIMITED TIME!

PLEASE ANSWER QUICKLY, AS THERE IS LIMITED TIME!PLEASE ANSWER QUICKLY, AS THERE IS LIMITED TIME!

The following table shows the actual demand observed over the last 11 years: Year 1 2 3 4 5 6 7 8 9 10 11 ] Demand 7 9 5 9 13 8 12 13 9 11 7 This exercise contains only parts b, c, and d. b) Using the 3-year moving average, provide the forecast from periods 4 through 12 (round your responses to one decimal place). Year 4 5 6 7 8 9 10 11 12 Forecast c) Using the 3-year weighted moving average with weights 0.10, 0.30, and 0.60, using 0.60 for the most recent period, provide the forecast from periods 4 through 12 (round your responses to one decimal place). Year 4 5 6 7 8 9 10 11 12 Forecast d) Mean absolute deviation for the forecast developed using the 3-year moving average is 2.33 and for the 3-year weighted moving average is 2.83. Based on this information, the better forecast is achieved using the approach

Step by Step Solution

There are 3 Steps involved in it

1 Expert Approved Answer
Step: 1 Unlock blur-text-image
Question Has Been Solved by an Expert!

Get step-by-step solutions from verified subject matter experts

Step: 2 Unlock
Step: 3 Unlock

Students Have Also Explored These Related General Management Questions!