

Question: Please answer the following question. Spreadsheet Problem 3-19 Start with the partial model in the file Cho3 Build Model.xlsx from the textbook's website. Build a
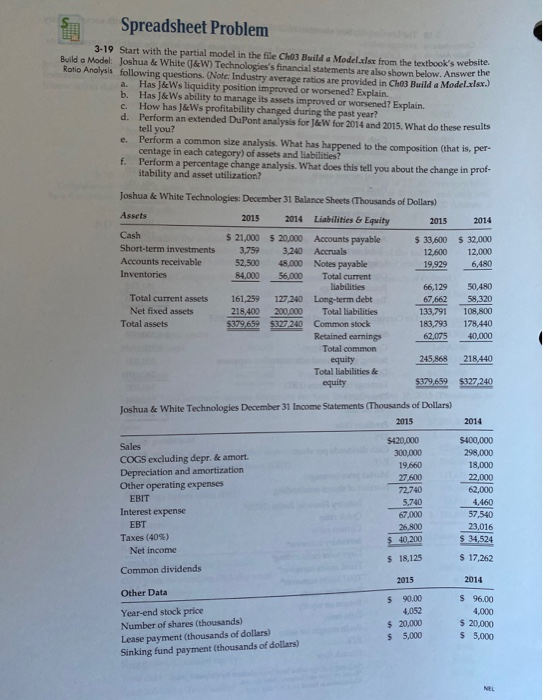
Spreadsheet Problem 3-19 Start with the partial model in the file Cho3 Build Model.xlsx from the textbook's website. Build a Model: Joshua & White (J&W) Technologies's financial statements are also shown below. Answer the Ratio Analysis following questions. (Note: Industry average ratios are provided in Cho3 Build a Model.xlsx) a. Has J&Ws liquidity position improved or worsened? Explain. b. Has J&Ws ability to manage its assets improved or worsened? Explain. c. How has J&Ws profitability changed during the past year? d. Perform an extended DuPont analysis for J&W for 2014 and 2015. What do these results tell you? Perform a common size analysis. What has happened to the composition (that is, per centage in each category) of assets and liabilities? f. Perform a percentage change analysis. What does this tell you about the change in prof- itability and asset utilization? 6.480 Joshua & White Technologies: December 31 Balance Sheets (Thousands of Dollars) Assets 2015 2014 Liabilities & Equity 2015 2014 Cash $ 21,000 $20,000 Accounts payable $ 33,600 $ 32,000 Short-term investments 3,759 3,240 Accruals 12,600 12.000 Accounts receivable 52,500 48,000 Notes payable 19.929 Inventories 84.000 56,000 Total current liabilities 50,480 Total current assets 161,259 127 240 Long-term debt 67,662 58,320 Net fixed assets 218,400 200.000 Total liabilities 133,791 108,800 Total assets $379,659 5327240 Common stock 183,793 178,440 Retained earning 62,075 40,000 Total common equity 245,868 218,440 Total liabilities & equity $379,659 $327 240 66,129 Joshua & White Technologies December 31 Income Statements (Thousands of Dollars) 2015 2014 $400,000 298,000 18,000 22.000 Sales COGS excluding depr. & amort. Depreciation and amortization Other operating expenses EBIT Interest expense EBT Taxes (409) Net income $420,000 300,000 19,660 27.600 72.740 5,740 67,000 26.800 $ 40.200 62,000 4.460 57,540 23,016 $ 34,524 $ 18.125 $ 17,262 Common dividends 2015 2014 Other Data Year-end stock price Number of shares (thousands) Lease payment (thousands of dollars) Sinking fund payment (thousands of dollars) $ 90.00 4,052 $ 20,000 $ 5,000 $ 96.00 4,000 $ 20,000 $ 5,000 NEL
Step by Step Solution
There are 3 Steps involved in it

Get step-by-step solutions from verified subject matter experts