

Question: Please Answer the following question. The excel file link is the following: https://docs.google.com/spreadsheets/d/1cHqzzTL3-32wk8cvTx_CgZXy-8lSaA-oE2M0Qfc_e20/edit?usp=sharing ll. Time series momentum: constant notional. For each instrument, consider the strategy
Please Answer the following question. The excel file link is the following:
https://docs.google.com/spreadsheets/d/1cHqzzTL3-32wk8cvTx_CgZXy-8lSaA-oE2M0Qfc_e20/edit?usp=sharing
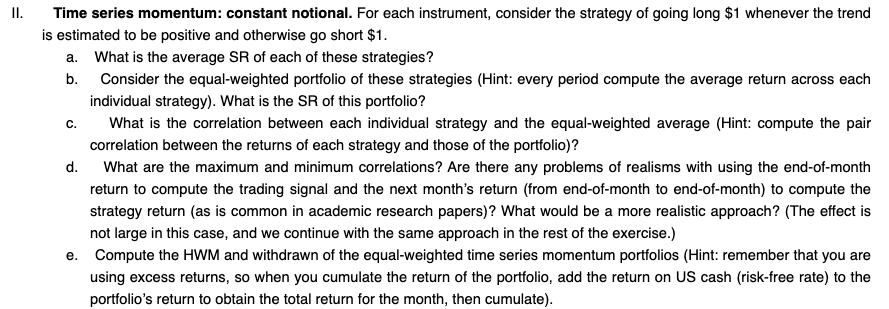
ll. Time series momentum: constant notional. For each instrument, consider the strategy of going long $1 whenever the trend is estimated to be positive and otherwise go short $1; a. What is the average SF! of each of these strategies? b. Consider the equal-weighted portfolio of these strategies (Hint: every period compute the average return across each individual strategy]. What is the SH of this portfolio? c. What is the correlation between each individual strategy and the equal-weighted average (Hint: compute the pair correlation between the retums of each strategy and those of the portfolio)? d. What are the maximum and minimum correlations? Are there any problems of raalisms with using the end-of-month return to compute the trading signal and the next month's retum (from end-of-month to end-of-month) to compute the strategy return (as is common in academic research papers)? What would be a more realistic approach? {The effect is not large in this case, and we continue with the same approach in the rest of the exercise.) e. Compute the HWM and withdrawn of the equal-weighted time series momentum portfolios (Hint: remember that you are using excess returns. so when you cumulate the return of the portfolio. add the return on US cash l{risk-free rate) to the portfolio's return to obtain the total ratum for the month, then cumulate}
Step by Step Solution
There are 3 Steps involved in it

Get step-by-step solutions from verified subject matter experts