

Question: Please answer these questions based on the supporting data provided beneath each one. I will be sure to UPVOTE for your useful help. Thank you!
Please answer these questions based on the supporting data provided beneath each one. I will be sure to UPVOTE for your useful help. Thank you!
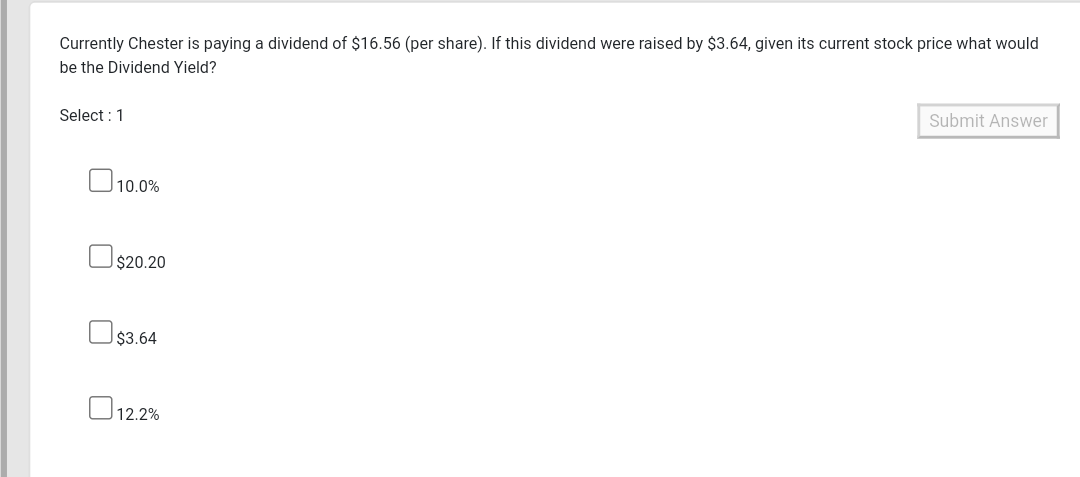
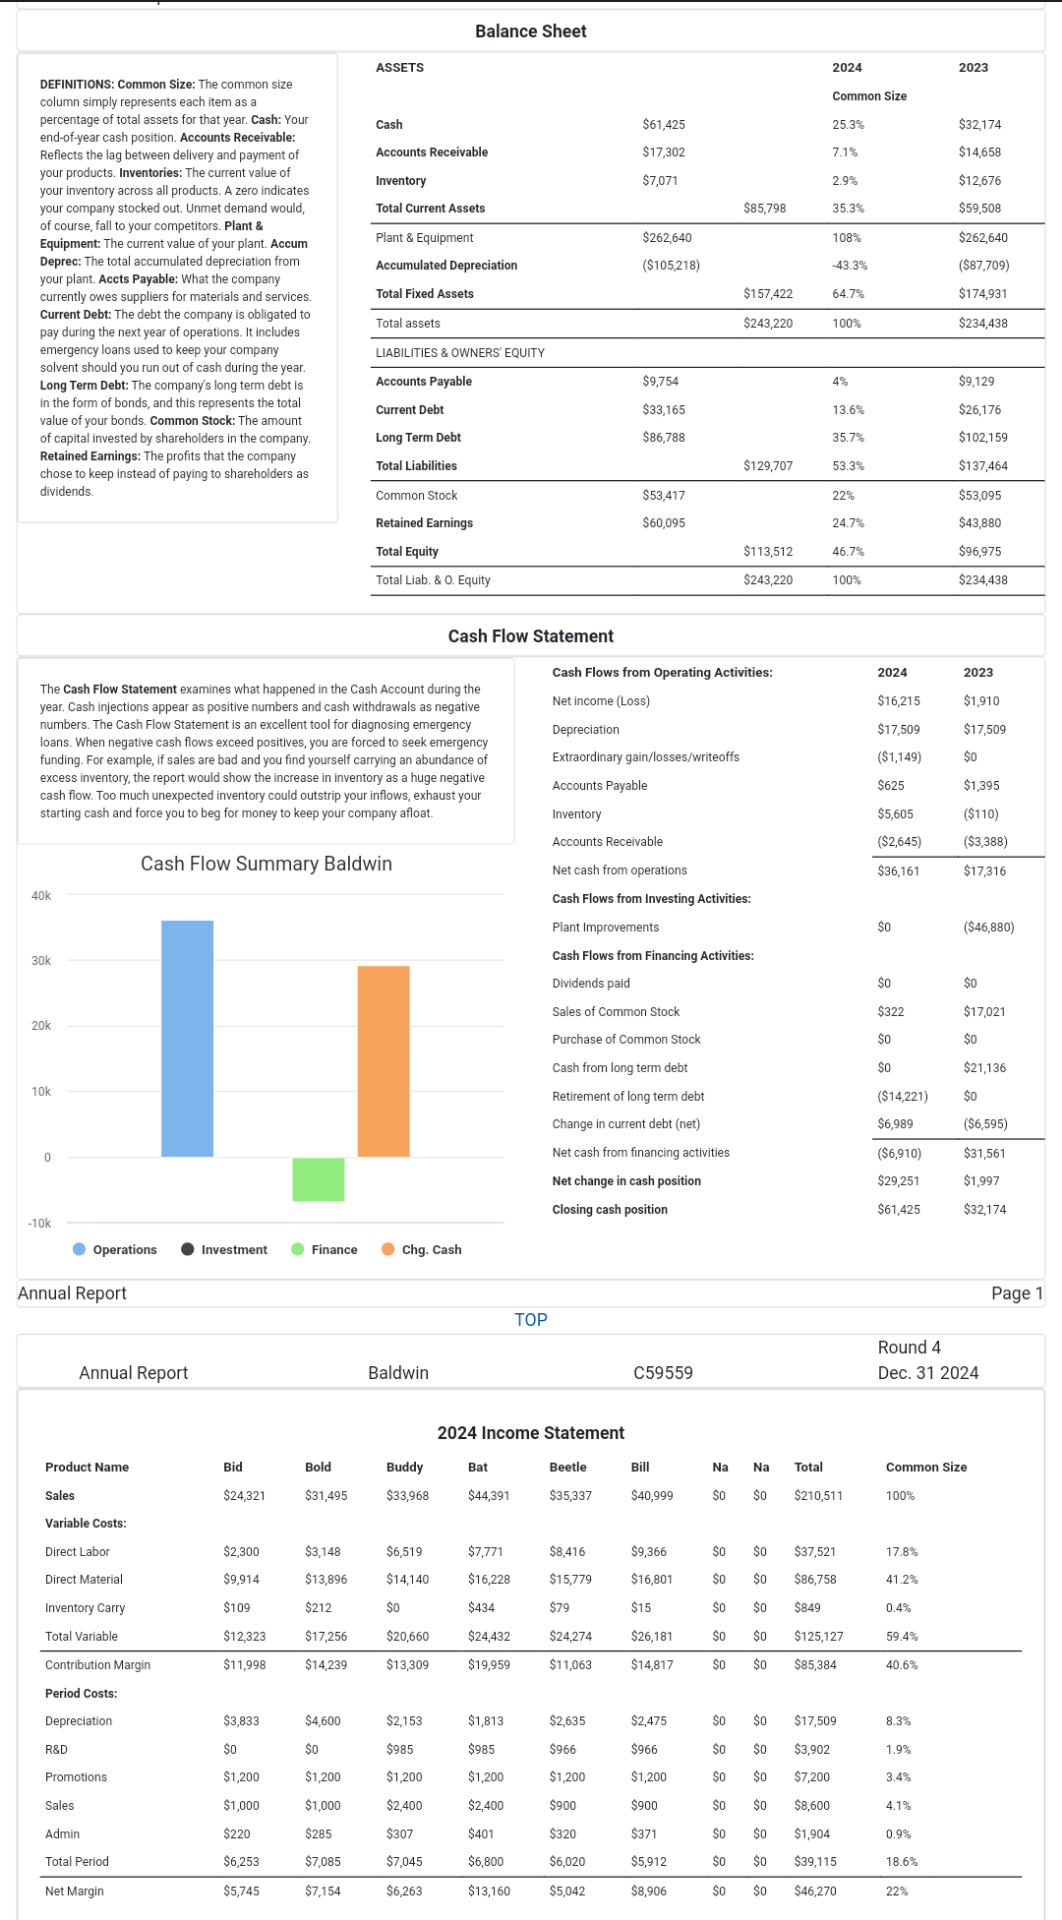
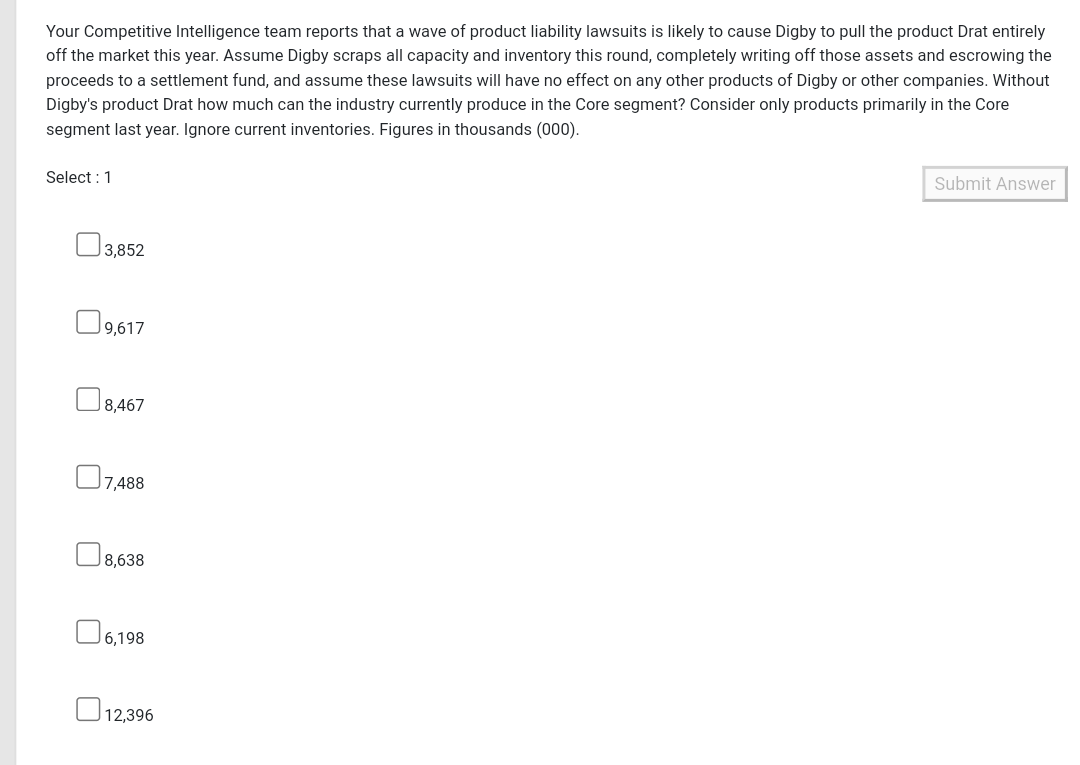
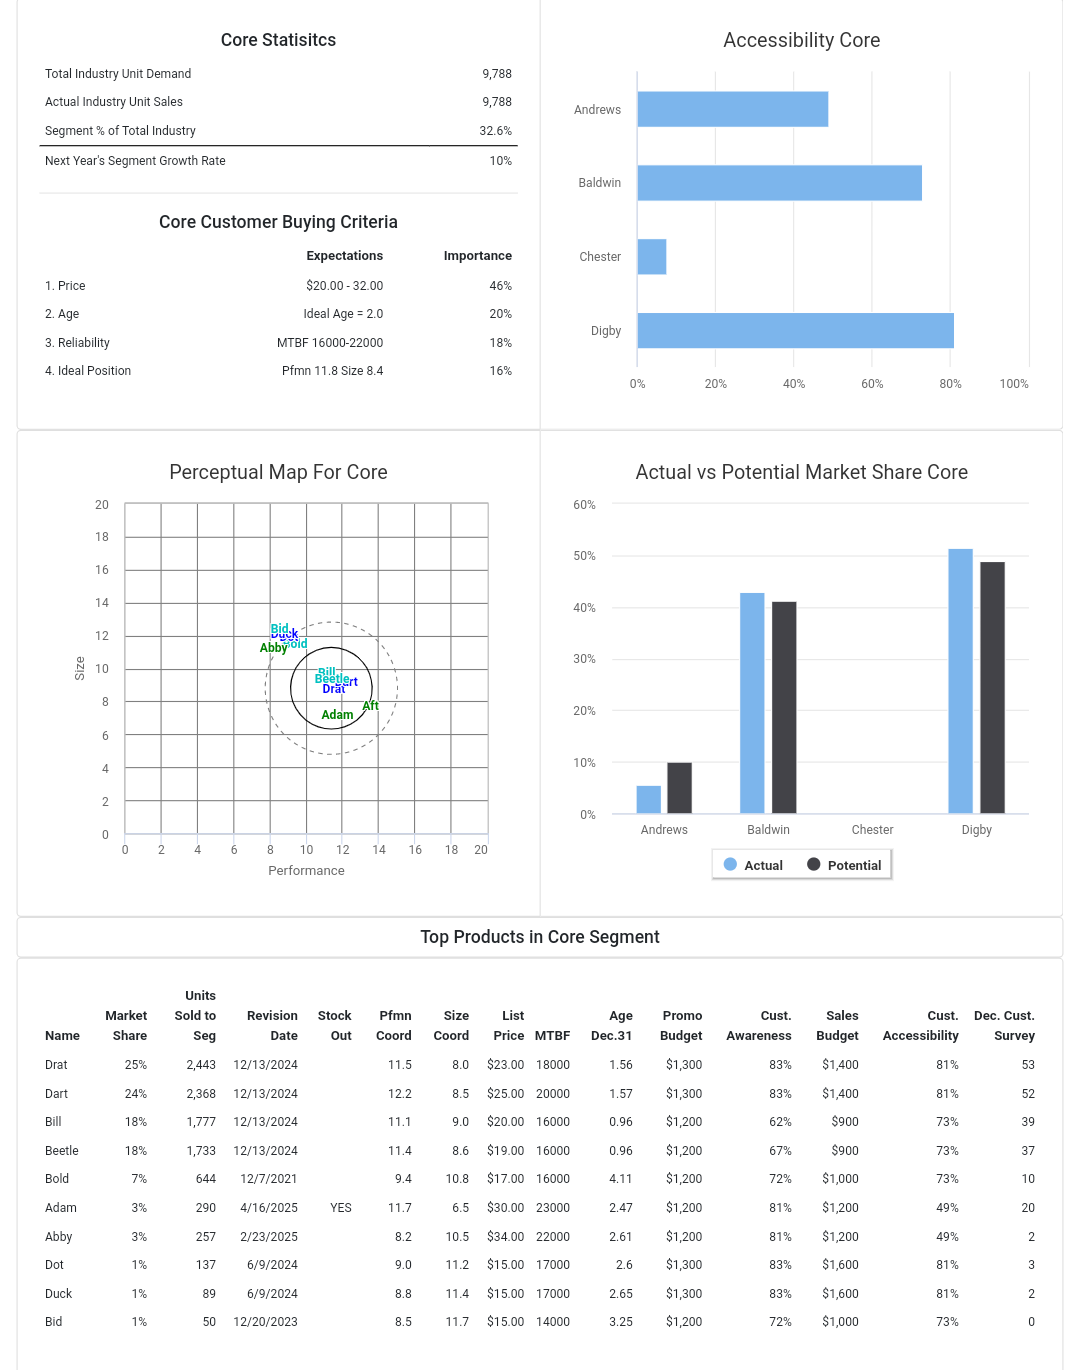
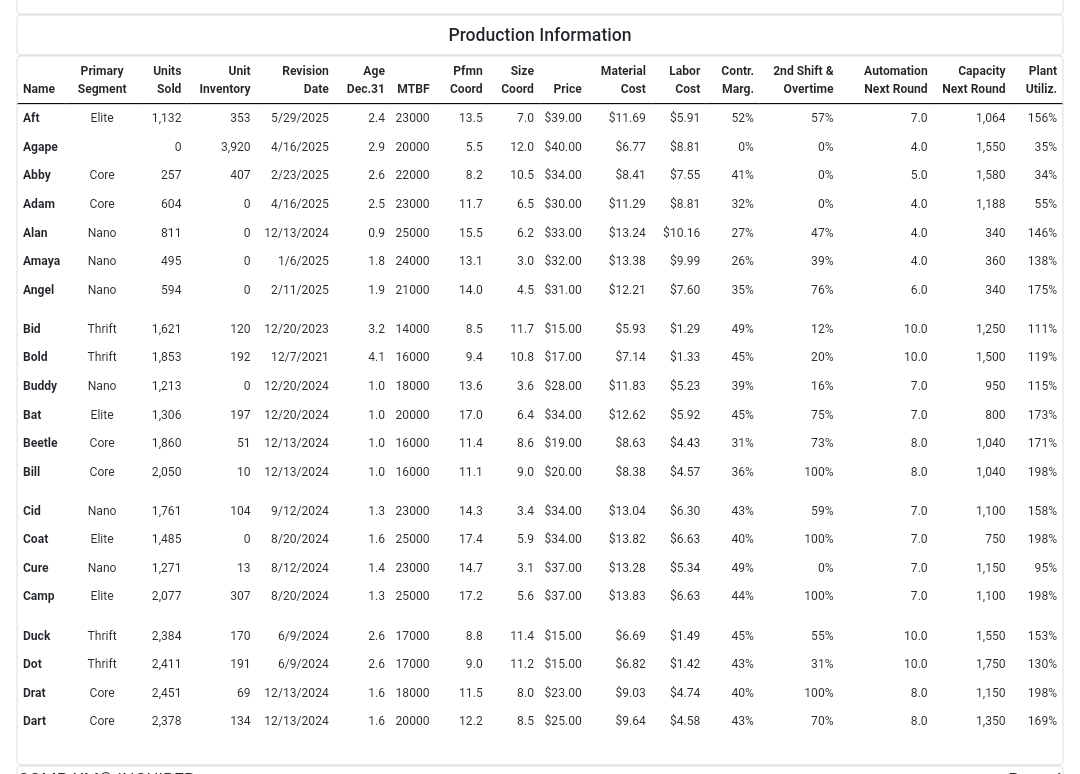
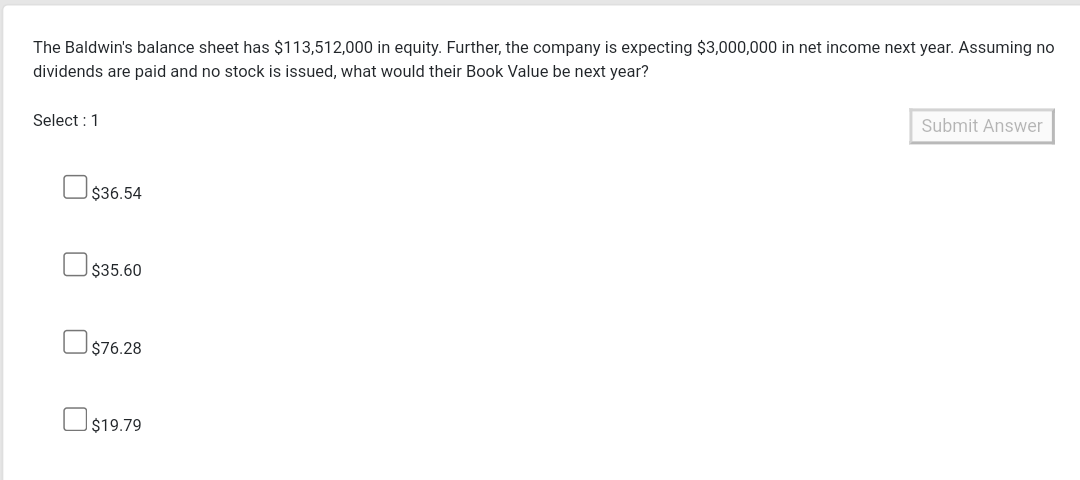
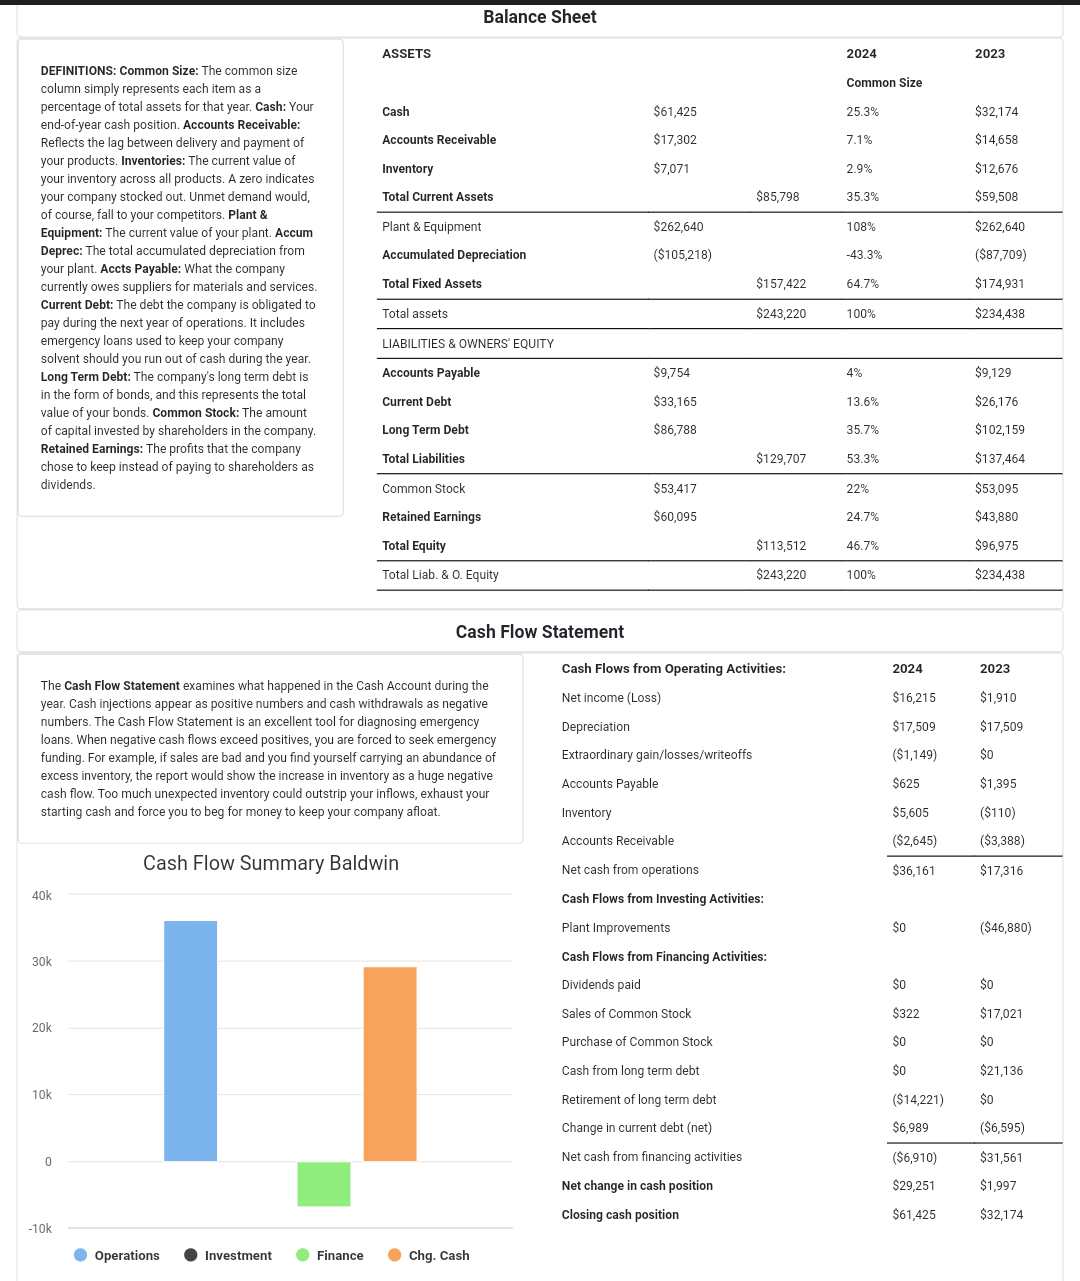
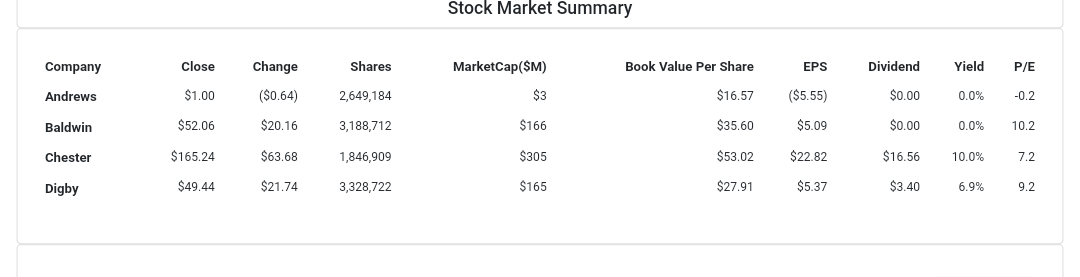
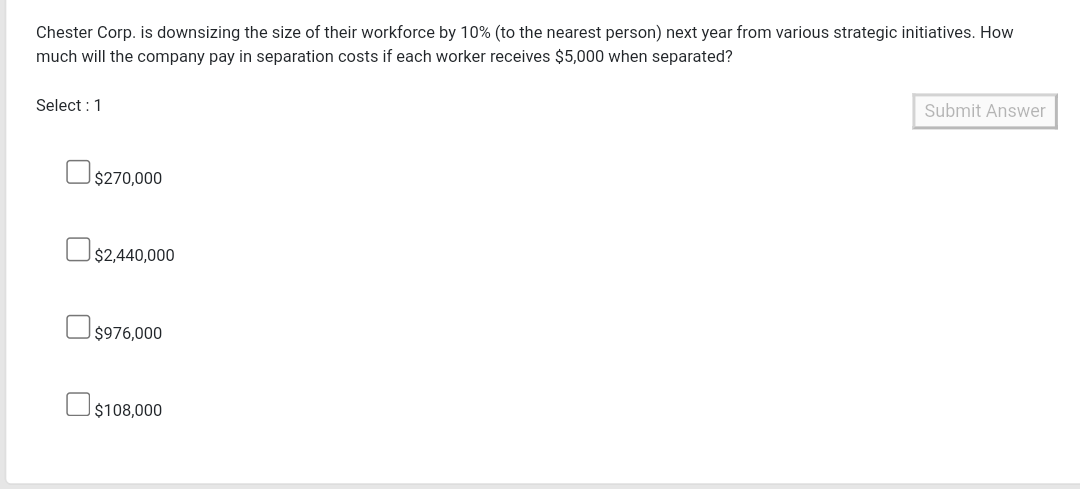
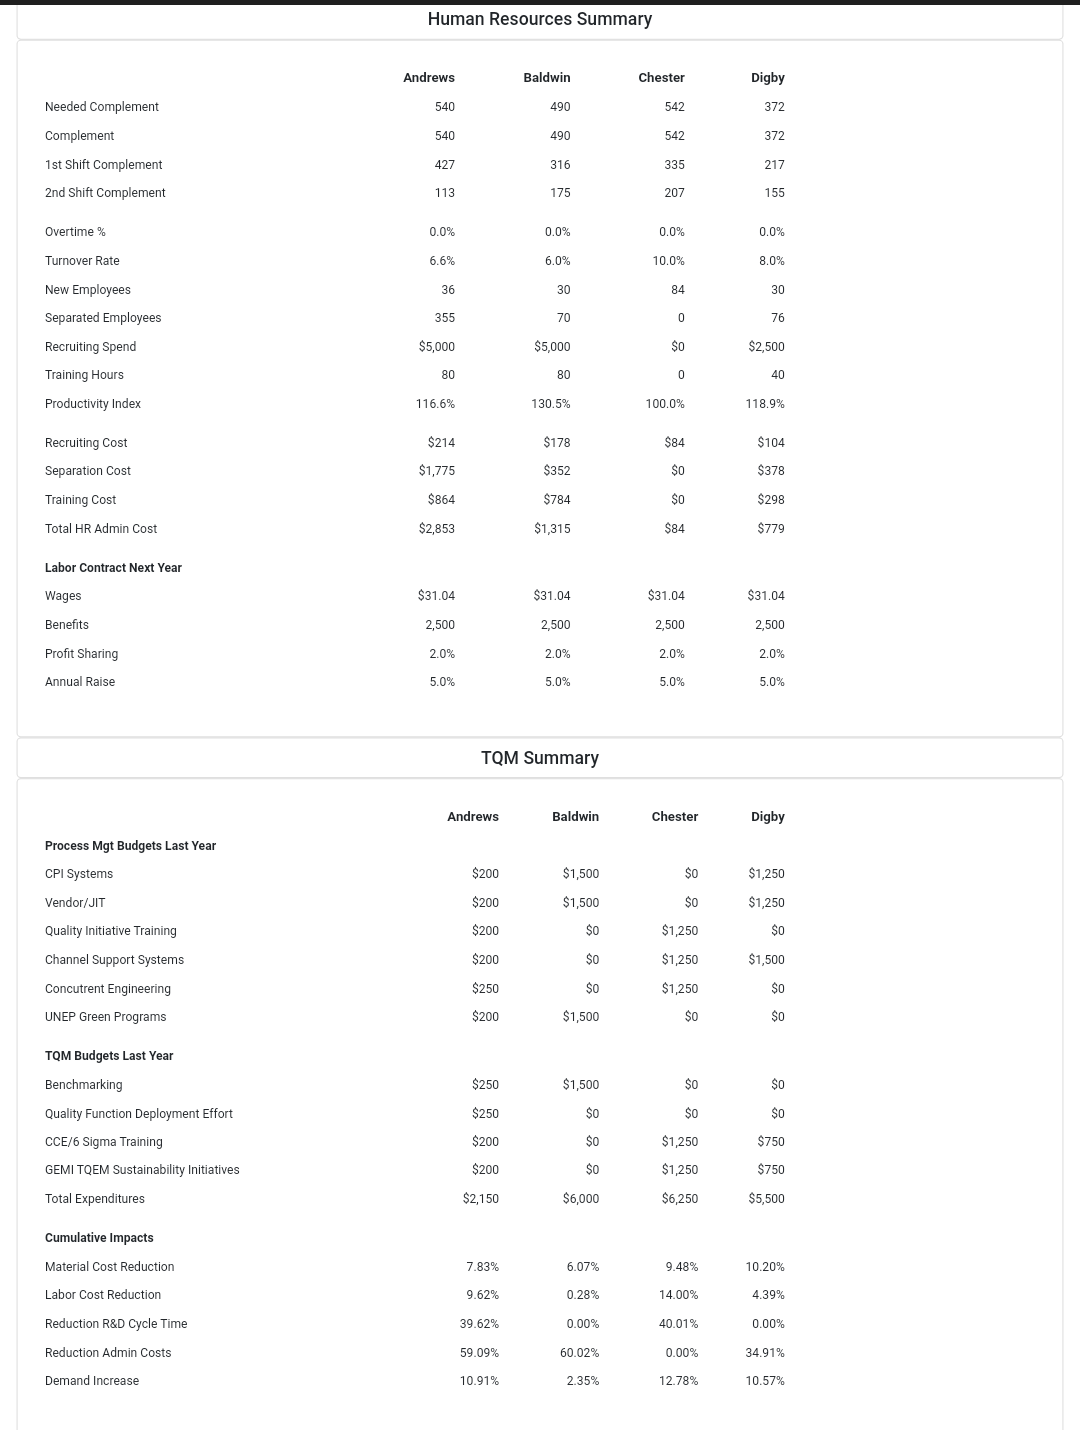
Currently Chester is paying a dividend of $16.56 (per share). If this dividend were raised by $3.64, given its current stock price what would be the Dividend Yield? Select: 1 Submit Answer 10.0% $20.20 $3.64 12.2% Balance Sheet ASSETS 2024 2023 Common Size Cash $61,425 25.3% $32.174 Accounts Receivable $17,302 7.1% $14,658 Inventory $7,071 2.9% $12,676 Total Current Assets $85,798 35.3% $59,508 $262,640 108% $262.640 Plant & Equipment Accumulated Depreciation ($105,218) -43.3% ($87,709) DEFINITIONS: Common Size: The common size column simply represents each item as a percentage of total assets for that year. Cash: Your end-of-year cash position. Accounts Receivable: Reflects the lag between delivery and payment of your products. Inventories: The current value of your inventory across all products. A zero indicates your company stocked out. Unmet demand would, of course, fall to your competitors. Plant & Equipment: The current value of your plant. Accum Deprec: The total accumulated depreciation from your plant. Accts Payable: What the company currently owes suppliers for materials and services. Current Debt: The debt the company is obligated to pay during the next year of operations. It includes emergency loans used to keep your company solvent should you run out of cash during the year. Long Term Debt: The company's long term debt is in the form of bonds, and this represents the total value of your bonds. Common Stock: The amount of capital invested by shareholders in the company Retained Earnings: The profits that the company chose to keep instead of paying to shareholders as dividends Total Fixed Assets $157,422 64.7% $174,931 Total assets $243,220 100% $234,438 LIABILITIES & OWNERS' EQUITY Accounts Payable $9,754 4% $9,129 Current Debt $33,165 13.6% $26,176 Long Term Debt $86,788 35.7% $102,159 Total Liabilities $ $129,707 53.3% $137,464 Common Stock $53,417 22% $53,095 Retained Earnings $60,095 24.7% $43,880 Total Equity $113,512 46.7% $96,975 Total Liab. &0. Equity $243,220 100% $234,438 Cash Flow Statement 2024 2023 Cash Flows from Operating Activities: Net income (Loss) $16,215 $1,910 Depreciation $17,509 $17,509 The Cash Flow Statement examines what happened in the Cash Account during the year. Cash injections appear as positive numbers and cash withdrawals as negative numbers. The Cash Flow Statement is an excellent tool for diagnosing emergency loans. When negative cash flows exceed positives, you are forced to seek emergency funding. For example, if sales are bad and you find yourself carrying an abundance of excess inventory, the report would show the increase in inventory as a huge negative cash flow. Too much unexpected inventory could outstrip your inflows, exhaust your starting cash and force you to beg for money to keep your company afloat. Extraordinary gain/losses/writeoffs ($1,149) $0 Accounts Payable $625 $1,395 Inventory $5,605 ($110) Accounts Receivable ($2,645) ($3,388) Cash Flow Summary Baldwin Net cash from operations $36,161 $17,316 40K Cash Flows from Investing Activities: SO ($46,880) Plant Improvements Cash Flows from Financing Activities: 30k Dividends paid SO $o Sales of Common Stock $322 $17,021 20k Purchase of Common Stock SO $0 Cash from long term debt $0 $21.136 10k ($14,221) $0 $6,989 ($6,595) Retirement of long term debt Change in current debt (net) Net cash from financing activities Net change in cash position Closing cash position 0 ($6,910) $31,561 $29,251 $1,997 $61,425 $32,174 -10k Operations Investment Finance Chg. Cash Annual Report Page 1 TOP Round 4 Dec. 31 2024 Annual Report Baldwin C59559 2024 Income Statement Product Name Bid Bold Buddy Bat Beetle Bill Na Na Total Common Size Sales $24,321 $31,495 $33,968 $44,391 $35,337 $40,999 $0 $0 $210,511 100% Variable Costs: Direct Labor $2,300 $3,148 $6,519 $7,771 $8,416 $9,366 $0 $0 $37,521 17.8% Direct Material $9,914 $13,896 $14,140 $16,228 $15,779 $16,801 SO $0 $86,758 41.2% Inventory Carry $109 $212 $0 $434 $79 $15 $0 $0 $849 0.4% Total Variable $12,323 $17,256 $20,660 $24,432 $24,274 $26,181 $0 $0 $125,127 59.4% Contribution Margin $11,998 $14,239 $13,309 $19,959 $11,063 $14,817 SO $0 $85,384 40.6% Period Costs: Depreciation $3,833 $4,600 $2,153 $1,813 $2,635 $2,475 $0 $0 $17,509 8.3% R&D $0 $0 $985 $985 $966 $966 $0 $0 $3,902 1.9% Promotions $1,200 $1,200 $1,200 $1,200 $1,200 $1,200 $0 $0 $7,200 3.4% Sales $1,000 $1,000 $2,400 $2,400 $900 $900 $0 $0 $8,600 4.1% Admin $220 $285 $307 $401 $320 $371 SO $0 $1,904 0.9% Total Period $6,253 $7,085 $7,045 $6,800 $6,020 $5,912 $0 $0 $39,115 18.6% Net Margin $5,745 $7,154 $6,263 $13,160 $5,042 $8,906 SO $0 $46,270 22% Your Competitive Intelligence team reports that a wave of product liability lawsuits is likely to cause Digby to pull the product Drat entirely off the market this year. Assume Digby scraps all capacity and inventory this round, completely writing off those assets and escrowing the proceeds to a settlement fund, and assume these lawsuits will have no effect on any other products of Digby or other companies. Without Digby's product Drat how much can the industry currently produce in the Core segment? Consider only products primarily in the Core segment last year. Ignore current inventories. Figures in thousands (000). Select : 1 Submit Answer 03, 3,852 9,617 8,467 7,488 8,638 6,198 12,396 Core Statisitcs Accessibility Core Total Industry Unit Demand 9,788 Actual Industry Unit Sales 9,788 Andrews Segment % of Total Industry 32.6% Next Year's Segment Growth Rate 10% Baldwin Core Customer Buying Criteria 11. Expectations Importance Chester 1. Price $20.00 - 32.00 46% 2. Age Ideal Age = 2.0 20% Digby 3. Reliability MTBF 16000-22000 18% 4. Ideal Position Pfmn 11.8 Size 8.4 16% 0% 20% 40% 60% 80% 100% Perceptual Map For Core Actual vs Potential Market Share Core 20 60% 18 50% 16 14 40% Bidik 12 Abby old 30% Size 10 IL 8 20% Adam Aft 6 10% 4 2 0% Andrews 0 Baldwin Chester Digby 0 2 4 6 14 16 18 20 8 10 12 Performance Actual Potential Top Products in Core Segment Units Sold to Seg Stock List Market Share Cust. Revision Date Pfmn Coord Size Coord Age Dec.31 Promo Budget Sales Budget Cust. Accessibility Dec. Cust. Survey Name Out Price MTBF Awareness Drat 25% 2,443 12/13/2024 11.5 8.0 $23.00 18000 1.56 $1,300 83% $1,400 81% 53 Dart 24% 2,368 12/13/2024 12.2. 8.5 $25.00 20000 1.57 $1,300 83% $1,400 81% 52 Bill 18% 1,777 12/13/2024 11.1 9.0 $20.00 16000 0.96 $1,200 62% $900 73% 39 Beetle 18% 1,733 12/13/2024 11.4 8.6 $19.00 16000 0.96 $1,200 67% $900 73% 37 Bold 7% 644 12/7/2021 9.4 10.8 $17.00 16000 4.11 $1,200 72% $1,000 73% 10 Adam 3% 290 4/16/2025 YES 11.7 6.5 $30.00 23000 2.47 $1,200 81% $1,200 49% 20 Abby 3% 257 2/23/2025 8.2 10.5 $34.00 22000 2.61 $1,200 81% $1,200 49% 2 Dot 1% 137 6/9/2024 9.0 11.2 $15.00 17000 2.6 $1,300 83% $1,600 81% 3 Duck 1% 89 6/9/2024 8.8 11.4 $15.00 17000 2.65 $1,300 83% $1,600 81% 2 Bid 1% 50 12/20/2023 8.5 11.7 $15.00 14000 3.25 $1,200 72% $1,000 73% 0 Production Information Labor Primary Segment Units Unit Sold Inventory Name Revision Age Pfmn Size Date Dec.31 MTBF Coord Coord Price Material Cost Contr. Marg. 2nd Shift & Overtime Automation Capacity Next Round Next Round Plant Utiliz. Cost Aft Elite 1,132 353 5/29/2025 2.4 23000 13.5 7.0 $39.00 $11.69 $5.91 52% 57% 7.0 1,064 156% Agape 0 3,920 4/16/2025 2.9 20000 5.5 12.0 $40.00 $6.77 $8.81 0% 0% 4.0 1,550 35% Abby Core 257 407 2/23/2025 2.6 22000 8.2 10.5 $34.00 $8.41 $7.55 41% 0% 5.0 1,580 34% Adam Core 604 0 4/16/2025 2.5 23000 11.7 6.5 $30.00 $11.29 $8.81 32% 0% 4.0 1,188 55% Alan Nano 811 0 12/13/2024 0.9 25000 15.5 6.2 $33.00 $13.24 $10.16 27% 47% 4.0 340 146% Amaya Nano 495 0 1/6/2025 1.8 24000 13.1 3.0 $32.00 $13.38 $9.99 26% 39% 4.0 360 138% Angel Nano 594 0 2/11/2025 1.9 21000 14.0 4.5 $31.00 $12.21 $7.60 35% 76% 6.0 340 175% Bid Thrift 1,621 120 12/20/2023 3.2 14000 8.5 11.7 $15.00 $5.93 $1.29 49% 12% 10.0 1,250 111% Bold Thrift 1,853 192 12/7/2021 4.1 16000 9.4 10.8 $17.00 $7.14 $1.33 45% 20% 10.0 1,500 119% Buddy Nano 1,213 0 12/20/2024 1.0 18000 13.6 3.6 $28.00 $11.83 $5.23 39% 16% 7.0 950 115% Bat Elite 1,306 197 12/20/2024 1.0 20000 17.0 6.4 $34.00 $12.62 $5.92 45% 75% 7.0 800 173% Beetle Core 1,860 51 12/13/2024 1.0 16000 11.4 8.6 $19.00 $8.63 $4.43 31% 73% 8.0 1,040 171% Bill Core 2,050 10 12/13/2024 1.0 16000 11.1 9.0 $20.00 $8.38 $4.57 36% 100% 8.0 1,040 198% Cid Nano 1,761 104 9/12/2024 1.3 23000 14.3 3.4 $34.00 $13.04 $6.30 43% 59% 7.0 1,100 158% Coat Elite 1,485 0 8/20/2024 1.6 25000 17.4 5.9 $34.00 $13.82 $6.63 40% 100% 7.0 750 198% Cure Nano 1,271 13 8/12/2024 1.4 23000 14.7 3.1 $37.00 $13.28 $5.34 49% 0 0% 7.0 1,150 95% % Camp Elite 2,077 307 8/20/2024 1.3 25000 17.2 5.6 $37.00 $13.83 $6.63 44% 100% 7.0 1,100 198% Duck Thrift 2,384 170 6/9/2024 2.6 17000 8.8 11.4 $15.00 $6.69 $1.49 45% 55% 10.0 1,550 153% Dot Thrift 2,411 191 6/9/2024 2.6 17000 9.0 11.2 $15.00 $6.82 $1.42 43% 31% 10.0 1,750 130% Drat Core 2,451 69 12/13/2024 1.6 18000 11.5 8.0 $23.00 $9.03 $4.74 40% 100% 8.0 1,150 198% Dart Core 2,378 134 12/13/2024 1.6 20000 12.2. 8.5 $25.00 $9.64 $4.58 43% 70% 8.0 1,350 169% The Baldwin's balance sheet has $113,512,000 in equity. Further, the company is expecting $3,000,000 in net income next year. Assuming no dividends are paid and no stock is issued, what would their Book Value be next year? Select : 1 Submit Answer $36.54 $35.60 $76.28 $19.79 Balance Sheet ASSETS 2024 2023 Common Size Cash $61,425 25.3% $32,174 Accounts Receivable $17,302 7.1% $14,658 Inventory $7,071 2.9% $12,676 Total Current Assets $85,798 35.3% $59,508 Plant & Equipment $262,640 108% $262,640 Accumulated Depreciation ($105,218) -43.3% ($87,709) DEFINITIONS: Common Size: The common size column simply represents each item as a percentage of total assets for that year. Cash: Your end-of-year cash position. Accounts Receivable: Reflects the lag between delivery and payment of your products. Inventories: The current value of your inventory across all products. A zero indicates your company stocked out. Unmet demand would, of course, fall to your competitors. Plant & Equipment: The current value of your plant. Accum Deprec: The total accumulated depreciation from your plant. Accts Payable: What the company currently owes suppliers for materials and services. Current Debt: The debt the company is obligated to pay during the next year of operations. It includes emergency loans used to keep your company solvent should you run out of cash during the year. Long Term Debt: The company's long term debt is in the form of bonds, and this represents the total value of your bonds. Common Stock: The amount of capital invested by shareholders in the company. Retained Earnings: The profits that the company chose to keep instead of paying to shareholders as dividends. Total Fixed Assets $157,422 64.7% $174,931 Total assets $243,220 100% $234,438 LIABILITIES & OWNERS' EQUITY Accounts Payable $9,754 4% $9,129 Current Debt $33,165 13.6% $26,176 Long Term Debt $86,788 35.7% $102,159 Total Liabilities $129,707 53.3% $137,464 Common Stock $53,417 22% $53,095 Retained Earnings $60,095 24.7% $43,880 Total Equity $113,512 46.7% $96,975 Total Liab. & O. Equity $243,220 100% $234,438 Cash Flow Statement 2024 2023 Cash Flows from Operating Activities: Net income (Loss) $16,215 $1,910 Depreciation $17,509 $17,509 The Cash Flow Statement examines what happened in the Cash Account during the year. Cash injections appear as positive numbers and cash withdrawals as negative numbers. The Cash Flow Statement is an excellent tool for diagnosing emergency loans. When negative cash flows exceed positives, you are forced to seek emergency funding. For example, if sales are bad and you find yourself carrying an abundance of excess inventory, the report would show the increase in inventory as a huge negative cash flow. Too much unexpected inventory could outstrip your inflows, exhaust your starting cash and force you to beg for money to keep your company afloat. Extraordinary gain/losses/writeoffs ($1,149) $0 Accounts Payable $625 $1,395 Inventory $5,605 ($110) Accounts Receivable ($2,645) ($3,388) Cash Flow Summary Baldwin Net cash from operations $36,161 $17,316 40K Cash Flows from Investing Activities: Plant Improvements $0 ($46,880) 30k Cash Flows from Financing Activities: Dividends paid $0 $0 Sales of Common Stock $322 $17,021 20k Purchase of Common Stock $0 $0 Cash from long term debt $0 $21,136 10k Retirement of long term debt ($14,221) $0 Change in current debt (net) $6,989 ($6,595) 0 Net cash from financing activities ($6,910) $31,561 $29,251 $1,997 Net change in cash position Closing cash position $61,425 $32,174 -10k Operations Investment Finance Chg. Cash Stock Market Summary Company Close Change Shares MarketCap(SM) Book Value Per Share EPS Dividend Yield P/E Andrews ($0.64) 2,649,184 $3 3 $16.57 $ ($5.55) $0.00 0.0% -0.2 $1.00 $52.06 Baldwin $20.16 3,188,712 $166 $35.60 $5.09 $0.00 0.0% 10.2 Chester $165.24 $63.68 1,846,909 $305 $53.02 $22.82 $16.56 10.0% 7.2 Digby $49.44 $21.74 3,328,722 $165 $27.91 $5.37 $ $3.40 6.9% 9.2 Chester Corp. is downsizing the size of their workforce by 10% (to the nearest person) next year from various strategic initiatives. How much will the company pay in separation costs if each worker receives $5,000 when separated? Select: 1 Submit Answer $270,000 $2,440,000 $976,000 $108,000 Human Resources Summary Andrews Baldwin Chester Digby Needed Complement 540 490 542 372 540 490 542 372 Complement 1st Shift Complement 427 316 335 217 2nd Shift Complement 113 175 207 155 Overtime % 0.0% 0.0% 0.0% 0.0% Turnover Rate 6.6% 6.0% 10.0% 8.0% New Employees 36 30 84 30 Separated Employees 355 70 0 76 Recruiting Spend $5,000 $5,000 $0 $2,500 Training Hours 80 80 0 40 Productivity Index 116.6% 130.5% 100.0% 118.9% Recruiting Cost $214 $178 $84 $104 Separation Cost $1,775 $352 $0 $378 Training Cost $864 $784 $0 $298 Total HR Admin Cost $2,853 $1,315 $84 $779 Labor Contract Next Year Wages $31.04 $31.04 $31.04 $31.04 Benefits 2,500 2,500 2,500 2,500 Profit Sharing 2.0% 2.0% 2.0% 2.0% Annual Raise 5.0% 5.0% 5.0% 5.0% TQM Summary Andrews Baldwin Chester Digby Process Mgt Budgets Last Year CPI Systems $200 $1,500 $0 $1,250 Vendor/JIT $200 $1,500 $0 $1,250 Quality Initiative Training $200 $0 $1,250 $0 Channel Support Systems $200 $0 $1,250 $1,500 Concutrent Engineering $250 $0 $1,250 $0 UNEP Green Programs $200 $1,500 $0 $0 TQM Budgets Last Year Benchmarking $250 $1,500 SO SO Quality Function Deployment Effort $250 $0 $0 $0 CCE/6 Sigma Training $200 $0 $1,250 $750 GEMI TQEM Sustainability Initiatives $200 $0 $1,250 $750 Total Expenditures $2,150 $6,000 $6,250 $5,500 Cumulative Impacts Material Cost Reduction 7.83% 6.07% 9.48% 10.20% Labor Cost Reduction 9.62% 0.28% 14.00% 4.39% Reduction R&D Cycle Time 39.62% 0.00% 40.01% 0.00% Reduction Admin Costs 59.09% 60.02% 0.00% 34.91% Demand Increase 10.91% 2.35% 12.78% 10.57%Step by Step Solution
There are 3 Steps involved in it
1 Expert Approved Answer
Step: 1 Unlock

Question Has Been Solved by an Expert!
Get step-by-step solutions from verified subject matter experts
Step: 2 Unlock
Step: 3 Unlock