

Question: please answer this as soon as possible, it's urgent. Q1- Jane and John's Goodie Baskets had been using an averaging forecasting model. They thought they
please answer this as soon as possible, it's urgent.
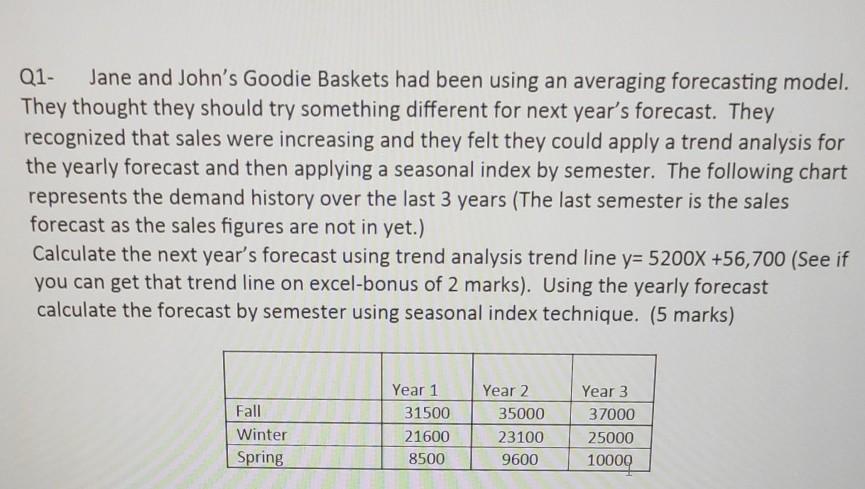
Q1- Jane and John's Goodie Baskets had been using an averaging forecasting model. They thought they should try something different for next year's forecast. They recognized that sales were increasing and they felt they could apply a trend analysis for the yearly forecast and then applying a seasonal index by semester. The following chart represents the demand history over the last 3 years (The last semester is the sales forecast as the sales figures are not in yet.) Calculate the next year's forecast using trend analysis trend line y= 5200X +56,700 (See if you can get that trend line on excel-bonus of 2 marks). Using the yearly forecast calculate the forecast by semester using seasonal index technique. (5 marks) Fall Winter Spring Year 1 31500 21600 8500 Year 2 35000 23100 9600 Year 3 37000 25000 10000Step by Step Solution
There are 3 Steps involved in it
1 Expert Approved Answer
Step: 1 Unlock

Question Has Been Solved by an Expert!
Get step-by-step solutions from verified subject matter experts
Step: 2 Unlock
Step: 3 Unlock