Question: please answer this question and not just repost another one with different numbers!! Thank you! Excel Online Structured Activity: x-bar Chart The Hayley Girl Soup

please answer this question and not just repost another one with different numbers!! Thank you! please answer this question and not just repost
please answer this question and not just repost
Excel Online Structured Activity: x-bar Chart The Hayley Girl Soup Coy a soup manufacturer, has collected process data in order to construct control charts to use in its canning facility. It collected twenty four samples of four cans each hour over a twenty-four hour period, and the data has been collected in the Microsoft Excel Online file below. Open the spreadsheet and perform the required analysis to answer the questions below. Open spreadsheet Questions 1. What is the number of samples? Round your answer to the nearest whole number 2. What is the sample size? Round your answer to the nearest whole number 3. What is the overall mean? Do not round intermediate calculations, Round your answer to two decimal places 4. What is the average range? Round your answer to two decimal places B K D F H E G A X-bar Chart UCLX-bar 2 HOUR Center N Range Average LCLX-bar moco 3 4 5 6 NO CO 10 11 12 13 14 15 16 17 18 19 20 21 22 23 24 25 26 27 2 3 4 5 6 7 8 9 10 11 12 13 14 15 16 17 18 19 20 21 22 23 24 12.7 12.9 12.7 11.3 12.8 11.5 12.7 11.8 11.9 123 11.4 11.2 12.0 11.8 122 12.8 12.8 12.9 12.7 11.0 127 11.8 12.8 11.5 11.7 11.1 11.3 11.1 12.6 11.1 12.8 11.2. 11.1 12.7 11.5 11.4 11.5 12.6 12.6 11.6 12.6 12.8 11.1 12.9 12.9 126 120 12.8 3 11.9 11.5 11.8 122 120 12.3 11.9 11.5 12.3 11.0 12.1 120 11.8 11.1 11.5 126 11.3 12.9 11.6 12.1 4 11.7 12.1 12.5 12.5 12.8 12.3 122 12.5 11.7 11.8 11.2 11.0 11.9 12.9 11.3 12.4 11.7 12.6 11.5 12.9 12.7 12.5 12.4 11.4 11.0 12.4 12.9 11.2 A B B C D E F G H K Number of samples Sample size 31 24 21 12.7 12.9 11.0 12.7 25 22 11.8 12.6 12.4 12.5 26 23 12:8 120 12.9 12.4 27 24 11.5 12.8 11.2 11.4 28 29 Constants for Computing Control Chart Limits 30 A2 D4 D3 1.88 3.268 0 32 1.023 2.574 33 0.729 2.282 34 5 0.577 2.115 0 35 6 0.483 2.004 0 36 0.419 1.924 0.076 37 8 0.373 1.864 0.136 38 9 0.337 1.816 0.184 39 10 0.308 1.777 0.223 Ood Overall Mean Average Range CALOO Control Chart Factors A2

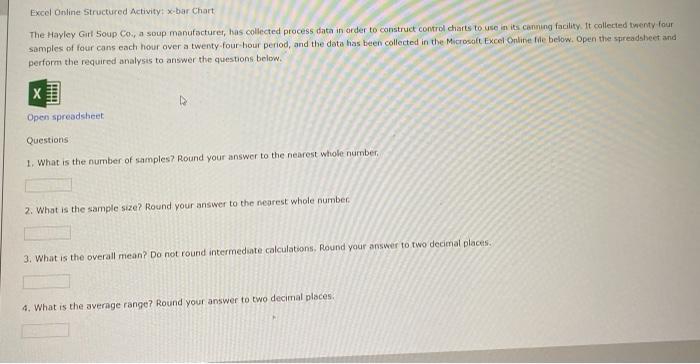
Step by Step Solution

There are 3 Steps involved in it

1 Expert Approved Answer
Step: 1 Unlock blur-text-image
Question Has Been Solved by an Expert!

Get step-by-step solutions from verified subject matter experts

Step: 2 Unlock
Step: 3 Unlock

Students Have Also Explored These Related General Management Questions!