

Question: please answer this question and not just repost another one with different numbers!! Thank you! Excel Online Structured Activity: R Chart The Hayley Girl Soup
please answer this question and not just repost another one with different numbers!! Thank you! 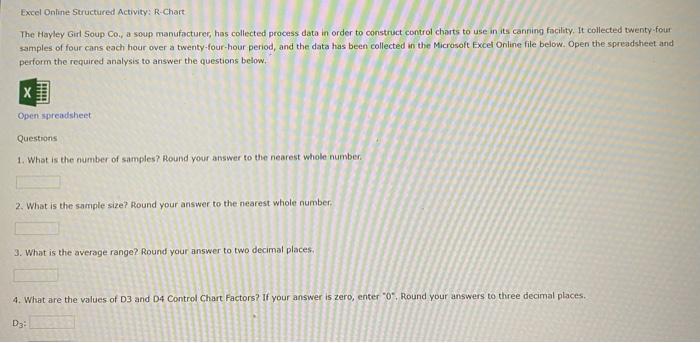
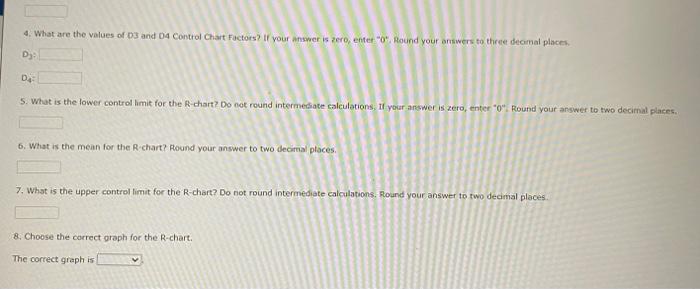
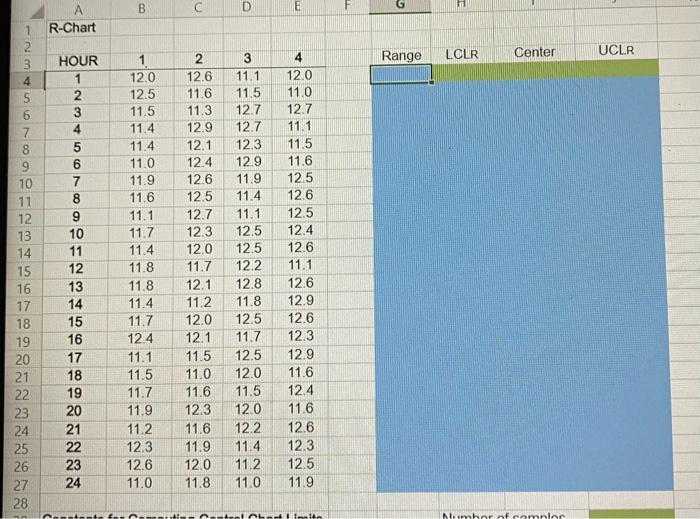
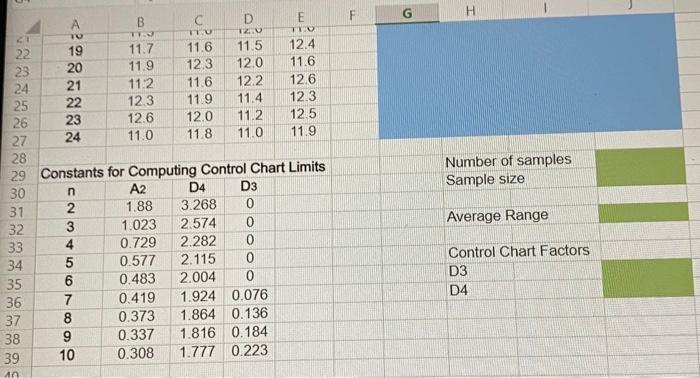
Excel Online Structured Activity: R Chart The Hayley Girl Soup Co., a soup manufacturer, has collected process data in order to construct control charts to use in its canning facility. It collected twenty-four samples of four cans each hour over a twenty-four hour period, and the data has been collected in the Microsoft Excel Online file below. Open the spreadsheet and perform the required analysis to answer the questions below. Open spreadsheet Questions 1. What is the number of samples? Round your answer to the nearest whole number 2. What is the sample size? Round your answer to the nearest whole number 3. What is the average range? Round your answer to two decimal places 4. What are the values of D3 and D4 Control Chart Factors? If your answer is zero, enter "0" Round your answers to three decimal places D3: 4. What are the values of D3 and 04 Control Chart Factors? If your answer is zero, enter"0" Round your answers to three decimal places D DE 5. What is the lower controllimit for the R-chart? Do not round intermediate calculations, If your answer is zero, enter "O". Round your answer to two decimal places. 6. What is the mean for the R chart? Round your answer to two decimal places. 7. What is the upper controllimit for the R-chart? Do not round intermediate calculations. Round your answer to two decimal places 8. Choose the correct graph for the R-chart. The correct graph is B D E A R-Chart HOUR Center Range UCLR N LCLR 00 NA UN 1 2 3 4 5 6 O ooooA6N- 2 3 4 5 7 8 8 9 10 11 12 13 14 15 16 17 18 19 20 21 22 23 24 25 26 27 28 10 11 12 13 14 15 16 17 18 19 20 21 22 23 24 12.0 12.5 11.5 11.4 11.4 11.0 11.9 11.6 11.1 11.7 11.4 11.8 11.8 11.4 11.7 12.4 11.1 11.5 11.7 11.9 11.2 12.3 12.6 11.0 12.6 11.6 11.3 12.9 12.1 12.4 12.6 12.5 12.7 12.3 12.0 11.7 12.1 11.2 12.0 12.1 11.5 11.0 11.6 12.3 11.6 11.9 12.0 11.8 3 11.1 11.5 12.7 12.7 12.3 12.9 11.9 11.4 11.1 12.5 12.5 12.2 12.8 11.8 12.5 11.7 12.5 12.0 11.5 12.0 122 11.4 11.2 11.0 4 12.0 11.0 12.7 11.1 11.5 11.6 12.5 12.6 12.5 12.4 12.6 11.1 12.6 12.9 12.6 12.3 12.9 11.6 12.4 11.6 12.6 12.3 125 11.9 tant limatta maramilan F G H Number of samples Sample size B C D E TO TU T20 TUD 22 19 11.7 11.6 11.5 12.4 23 20 11.9 12.3 12.0 11.6 24 21 112 11.6 12.2 12.6 25 22 12.3 11.9 11.4 12.3 26 23 12.6 12.0 11.2 12.5 27 24 11.0 11.8 11.0 11.9 28 29 Constants for Computing Control Chart Limits 30 A2 D4 D3 31 2 1.88 3.268 0 32 3 1.023 2.574 0 33 4 0.729 2.282 0 34 5 0.577 2.115 0 35 6 0.483 2.004 0 36 7 0.419 1.924 0.076 37 8 0.373 1.864 0.136 38 0.337 1.816 0.184 39 10 0.308 1.777 0.223 Average Range OOO OO ANS Control Chart Factors D3 D4 An Step by Step Solution
There are 3 Steps involved in it
1 Expert Approved Answer
Step: 1 Unlock

Question Has Been Solved by an Expert!
Get step-by-step solutions from verified subject matter experts
Step: 2 Unlock
Step: 3 Unlock