

Question: please answer this qushion CAB1 QUIZ 2 (CAB 1 Second Semester 20/21) > Copy the example data in the following.3 table and paste it in
please answer this qushion
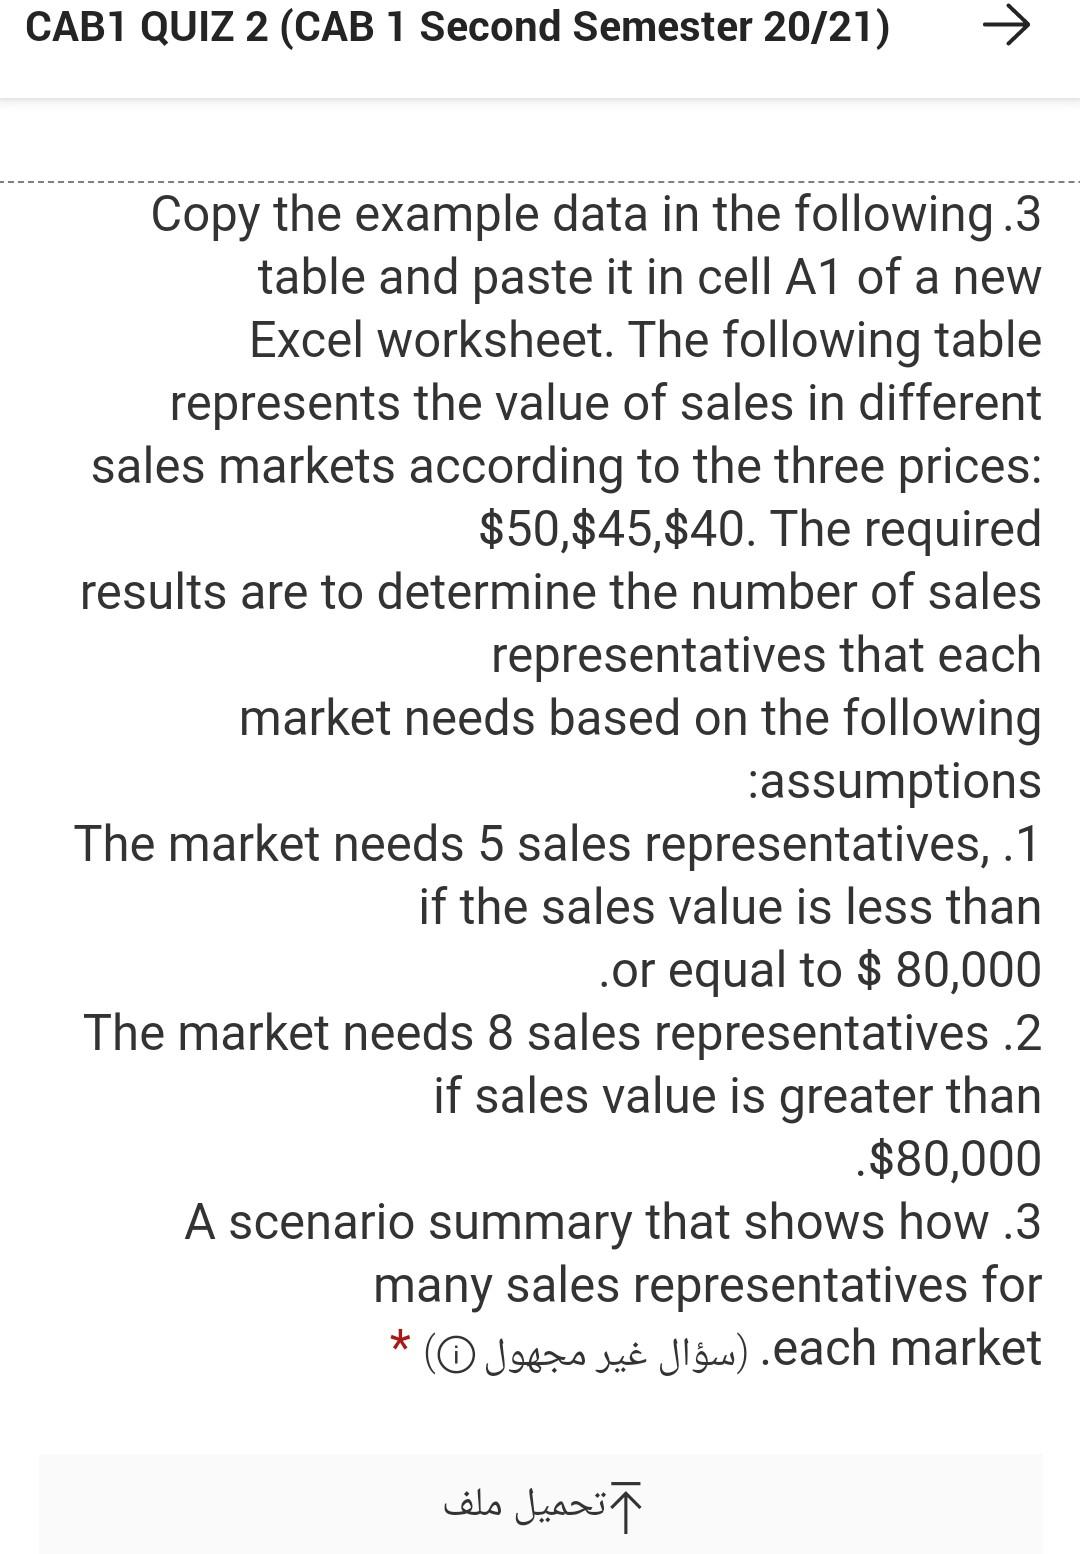
CAB1 QUIZ 2 (CAB 1 Second Semester 20/21) > Copy the example data in the following.3 table and paste it in cell A1 of a new Excel worksheet. The following table represents the value of sales in different sales markets according to the three prices: $50,$45,$40. The required results are to determine the number of sales representatives that each market needs based on the following :assumptions The market needs 5 sales representatives, .1 if the sales value is less than .or equal to $ 80,000 The market needs 8 sales representatives 2 if sales value is greater than .$80,000 A scenario summary that shows how .3 many sales representatives for O each market. ( ) CAB1 QUIZ 2 (CAB 1 Second Semester 20/21) > Copy the example data in the following.3 table and paste it in cell A1 of a new Excel worksheet. The following table represents the value of sales in different sales markets according to the three prices: $50,$45,$40. The required results are to determine the number of sales representatives that each market needs based on the following :assumptions The market needs 5 sales representatives, .1 if the sales value is less than .or equal to $ 80,000 The market needs 8 sales representatives 2 if sales value is greater than .$80,000 A scenario summary that shows how .3 many sales representatives for O each market. ( )
Step by Step Solution
There are 3 Steps involved in it

Get step-by-step solutions from verified subject matter experts