

Question: please answer wuestion 1 part A and B and show all calculated work with proper sigfigs use graph for reference Use the following table of
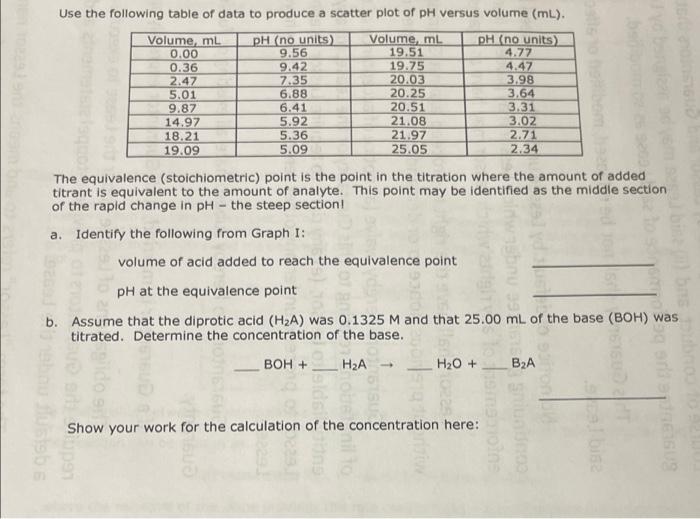
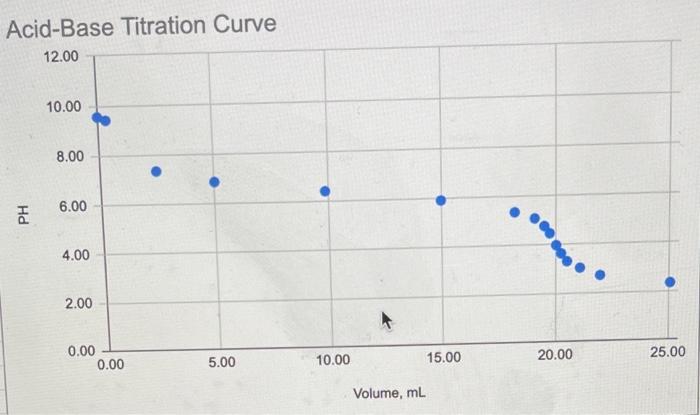
Use the following table of data to produce a scatter plot of pH versus volume (mL). Volume, ml pH (no units) Volume, ml. pH (no units) 0.00 9.56 19.51 4.77 0.36 9.42 19.75 4.47 2.47 7.35 20.03 3.98 5.01 6.88 20.25 3.64 9.87 6.41 20.51 3.31 14.97 5.92 21.08 3.02 18.21 5.36 21.97 2.71 19.09 5.09 25.05 2.34 . The equivalence (stoichiometric) point is the point in the titration where the amount of added titrant is equivalent to the amount of analyte. This point may be identified as the middle section of the rapid change in pH - the steep section! a. Identify the following from Graph I: volume of acid added to reach the equivalence point pH at the equivalence point b. Assume that the diprotic acid (H2A) was 0.1325 M and that 25.00 mL of the base (BOH) was titrated. Determine the concentration of the base. BOH + - HA H2O + B2A 15 SU BESUS SEOSED Show your work for the calculation of the concentration here: LGO Acid-Base Titration Curve 12.00 10.00 8.00 6.00 PH 4.00 ***.. 2.00 0.00 0.00 5.00 25.00 10.00 15.00 20.00 Volume, mL
Step by Step Solution
There are 3 Steps involved in it

Get step-by-step solutions from verified subject matter experts