

Question: please do by hand, and show all workings, no excel no coding Using table Q4c below, draw an network diagram, calculate float for each task
please do by hand, and show all workings, no excel no coding
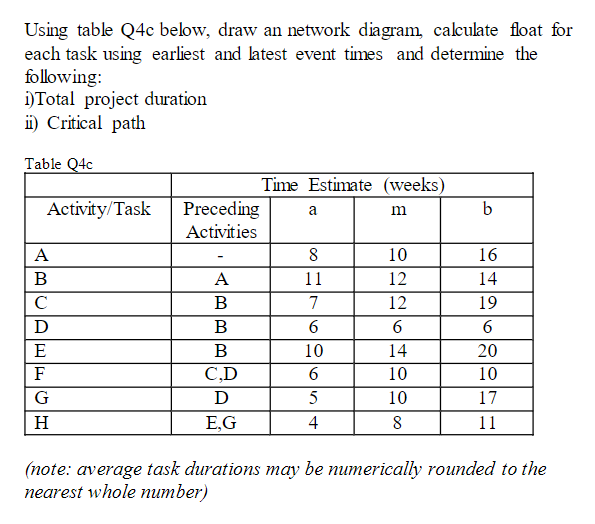
Using table Q4c below, draw an network diagram, calculate float for each task using earliest and latest event times and determine the following: i)Total project duration ii) Critical path (note: average task durations may be numerically rounded to the nearest whole number)
Step by Step Solution
There are 3 Steps involved in it
1 Expert Approved Answer
Step: 1 Unlock

Question Has Been Solved by an Expert!
Get step-by-step solutions from verified subject matter experts
Step: 2 Unlock
Step: 3 Unlock