Question: Please don't copy the answer to the same question in chegg. It's wrong Nexus Technologies (NT) designs, manufactures, markets and sells mobile phones. NT's mission
Please don't copy the answer to the same question in chegg. It's wrong
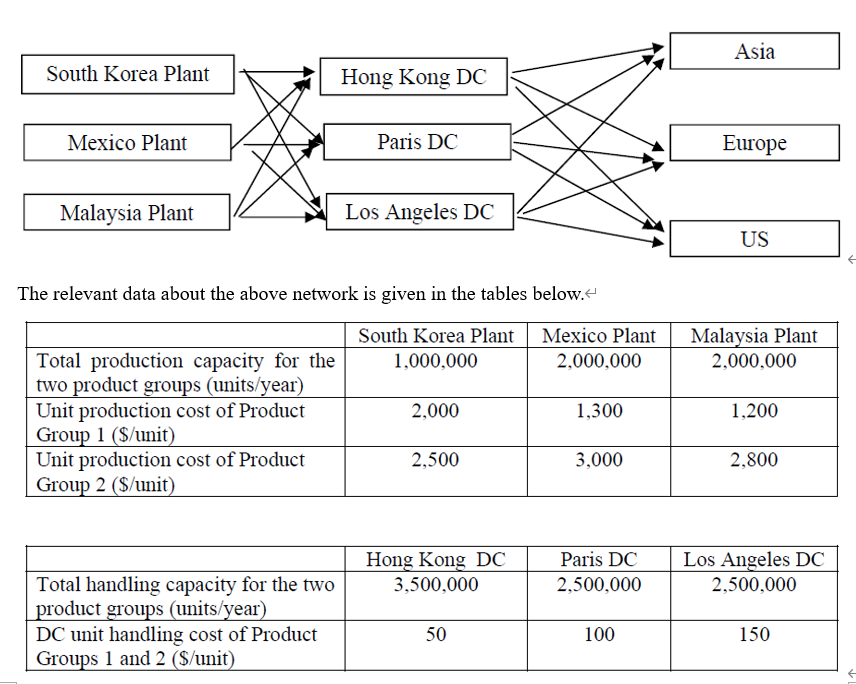
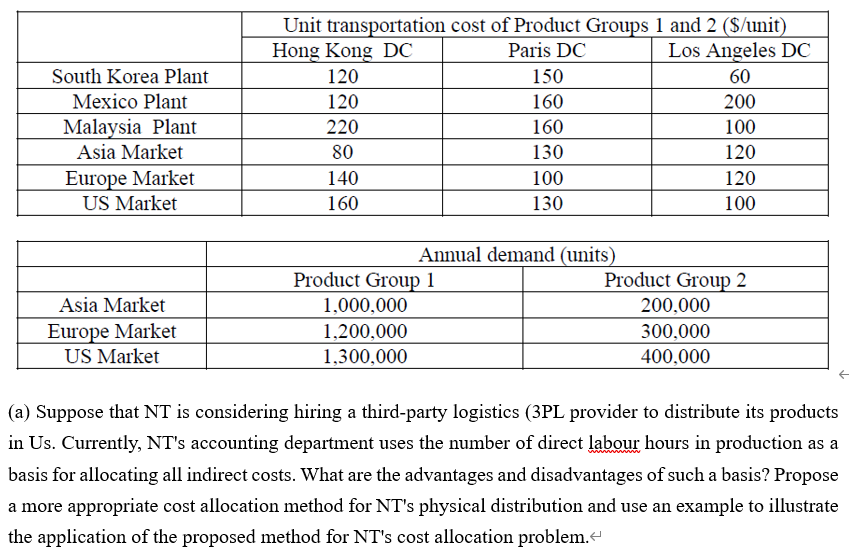
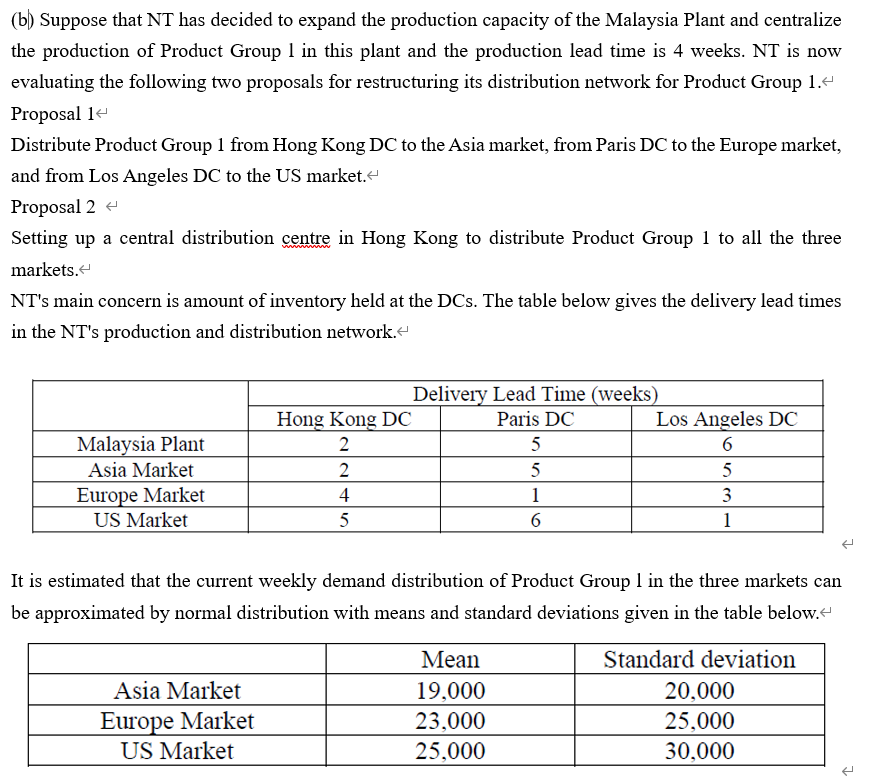
Nexus Technologies (NT) designs, manufactures, markets and sells mobile phones. NT's mission is to become the leading provider of mobile solutions. Its solutions strategy leverages one of its greatest assets - a portfolio of outstanding devices, with unmatched scale and geographic reach. NT couples them with smart services, integrated via an intuitive and seamless user experience. It differentiates these solutions based on its in-depth consumer understanding. & The mobile phone industry is characterized by short product lives and complex products. NT launches at least ten new products each year and some are relatively sophisticated. NT's products have a reputation in the market for being high quality. NT's product line comprises 2 productgroups-ProductGroupsland2. Product Group 1 consists of all the NT's mobile phones targeted at low-end market segment whereas all the state-of-the-art mobile phones are in Product Group 2.4 NT has three manufacturing plants, one in South Korea, one in Mexico and the other in Malaysia. All the three NT's manufacturing plants use similar production technologies, equipment and production management systems. NT has three distribution centres to distribute its products to the US, Europe and Asia markets. Product Group 2 retailers generally hold little inventory and expect NT to be responsive in meeting their demand. The diagram below shows NT's production and distribution network for the two product groups: Asia South Korea Plant Hong Kong DC Mexico Plant Paris DC Europe Malaysia Plant Los Angeles DC US Malaysia Plant 2,000,000 The relevant data about the above network is given in the tables below.' South Korea Plant Mexico Plant Total production capacity for the 1,000,000 2,000,000 two product groups (units/year) Unit production cost of Product 2,000 1,300 Group 1 ($/unit) Unit production cost of Product 2,500 3,000 Group 2 ($/unit) 1,200 2,800 Hong Kong DC 3,500,000 Paris DC 2,500,000 Los Angeles DC 2,500,000 Total handling capacity for the two product groups (units/year) DC unit handling cost of Product Groups 1 and 2 (S/unit) 50 100 150 South Korea Plant Mexico Plant Malaysia Plant Asia Market Europe Market US Market Unit transportation cost of Product Groups 1 and 2 ($/unit) Hong Kong DC Paris DC Los Angeles DC 120 150 60 120 160 200 220 160 100 80 130 120 140 100 120 160 130 100 Asia Market Europe Market US Market Annual demand (units) Product Group 1 Product Group 2 1,000,000 200,000 1,200,000 300,000 1,300,000 400,000 (a) Suppose that NT is considering hiring a third-party logistics (3PL provider to distribute its products in Us. Currently, NT's accounting department uses the number of direct labour hours in production as a basis for allocating all indirect costs. What are the advantages and disadvantages of such a basis? Propose a more appropriate cost allocation method for NT's physical distribution and use an example to illustrate the application of the proposed method for NT's cost allocation problem. (b) Suppose that NT has decided to expand the production capacity of the Malaysia Plant and centralize the production of Product Group 1 in this plant and the production lead time is 4 weeks. NT is now evaluating the following two proposals for restructuring its distribution network for Product Group 1.4 Proposal 14 Distribute Product Group 1 from Hong Kong DC to the Asia market, from Paris DC to the Europe market, and from Los Angeles DC to the US market. Proposal 2 + Setting up a central distribution centre in Hong Kong to distribute Product Group 1 to all the three markets. NT's main concern is amount of inventory held at the DCs. The table below gives the delivery lead times in the NT's production and distribution network. Malaysia Plant Asia Market Europe Market US Market Delivery Lead Time (weeks) Hong Kong DC Paris DC Los Angeles DC 2 5 6 2 5 5 4 1 3 5 6 1 It is estimated that the current weekly demand distribution of Product Group 1 in the three markets can be approximated by normal distribution with means and standard deviations given in the table below. Asia Market Europe Market US Market Mean 19,000 23,000 25,000 Standard deviation 20,000 25,000 30,000 NT has decided to use the (Q,R) policy to manage its inventory at the DCs i) Determine which proposal can minimize the average total amount of safety stock held at the DC(s) to achieve NT's target service of less than 5% stock-out probability at any DC.- + ii) If NT wants to keep the average total amount of safety stock below 150,000 units, determine the minimum reduction of the production lead time to achieve NT's target service of less than 5% stock-out probability at any DC. iii) Assuming that Q* is the optimal order quantity for the (Q.R) policy and NT's target service level is 50%. If NT's actual order quantity is equal to bxQ* where b is a non-negative real number, find the percentage increase in total inventory cost if the amount of safety stock is insignificant compared with


