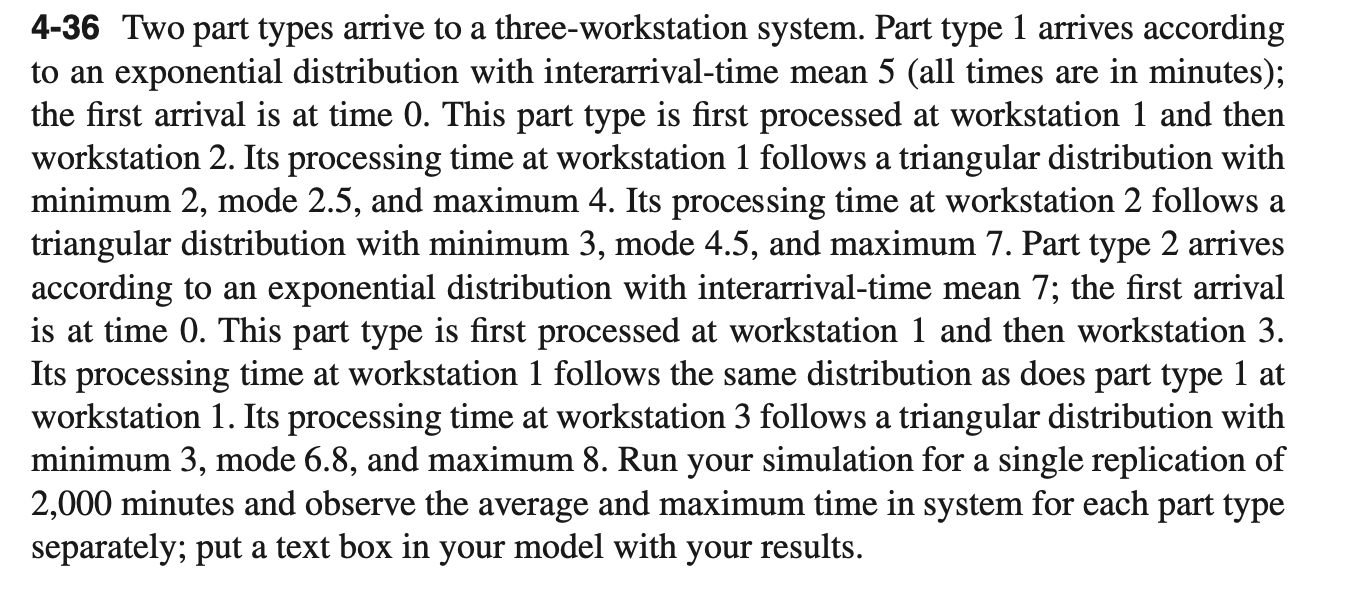
Question: PLEASE DRAW THE SIMULATION AND EXPLAIN THE DATA INPUTTED. DO NOT JUST POST THE RESULTS OF THE SIMULATION. 4-36 Two part types arrive to a

PLEASE DRAW THE SIMULATION AND EXPLAIN THE DATAPLEASE DRAW THE SIMULATION AND EXPLAIN THE DATA INPUTTED. DO NOT JUST POST THE RESULTS OF THE SIMULATION.

4-36 Two part types arrive to a three-workstation system. Part type 1 arrives according to an exponential distribution with interarrival-time mean 5 (all times are in minutes); the first arrival is at time 0. This part type is first processed at workstation 1 and then workstation 2. Its processing time at workstation 1 follows a triangular distribution with minimum 2, mode 2.5, and maximum 4. Its processing time at workstation 2 follows a triangular distribution with minimum 3, mode 4.5, and maximum 7. Part type 2 arrives according to an exponential distribution with interarrival-time mean 7; the first arrival is at time 0. This part type is first processed at workstation 1 and then workstation 3. Its processing time at workstation 1 follows the same distribution as does part type 1 at workstation 1. Its processing time at workstation 3 follows a triangular distribution with minimum 3, mode 6.8, and maximum 8. Run your simulation for a single repli 2,000 minutes and observe the average and maximum time in system for each part type separately; put a text box in your model with your results. tion of

Step by Step Solution

There are 3 Steps involved in it

1 Expert Approved Answer
Step: 1 Unlock blur-text-image
Question Has Been Solved by an Expert!

Get step-by-step solutions from verified subject matter experts

Step: 2 Unlock
Step: 3 Unlock

Students Have Also Explored These Related General Management Questions!