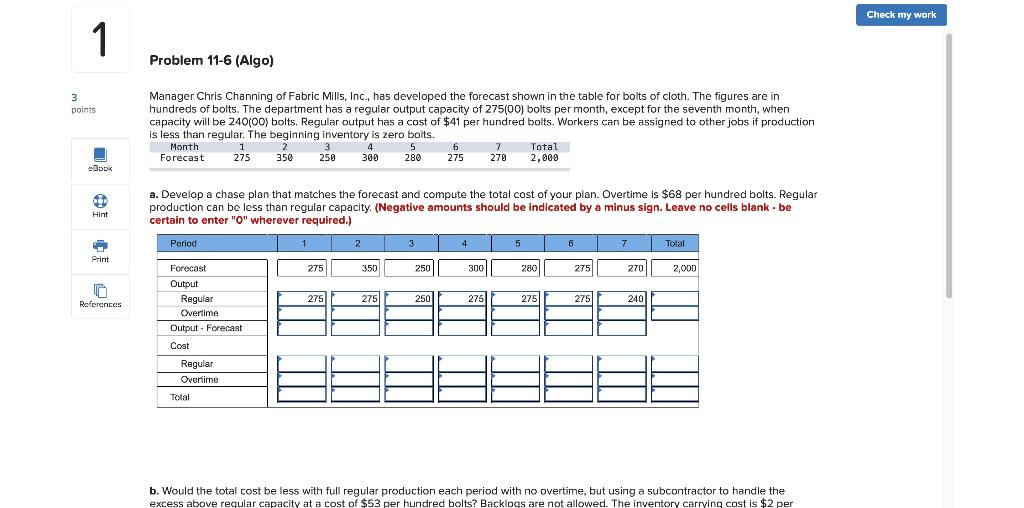
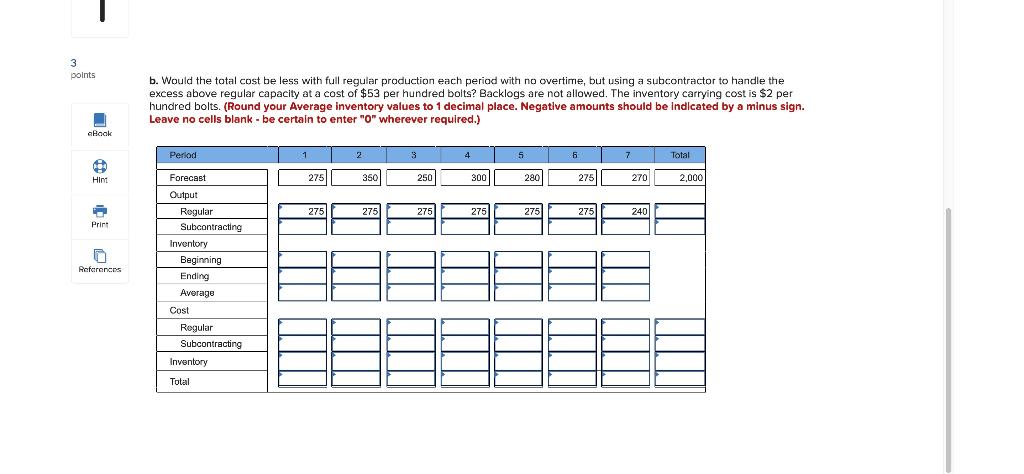
Question: Please explain step by step. Please do not give excel. Check my work 1 Problem 11-6 (Algo) 3 3 points Manager Chris Channing of Fabric

Please explain step by step. Please do not give excel.

Please explain step by step. Please do not givePlease explain step by step. Please do not give

Check my work 1 Problem 11-6 (Algo) 3 3 points Manager Chris Channing of Fabric Mills, Inc., has developed the forecast shown in the table for bolts of cloth. The figures are in hundreds of bolts. The department has a regular output capacity of 275(00) bolts per month, except for the seventh month, when capacity will be 240(00) bolts. Regular output has a cost of $41 per hundred bolts. Workers can be assigned to other jobs if production is less than regular. The beginning inventory is zero bolts. Month 3 6 7 Total Forecast 275 350 250 300 280 275 270 2,000 1 2 3 4 5 6 7 -SDDA a. Develop a chase plan that matches the forecast and compute the total cost of your plan. Overtime is $68 per hundred bolts. Regular production can be less than regular capacity. (Negative amounts should be indicated by a minus sign. Leave no cells blank.be certain to enter "0" wherever required.) Hint Period 2 3 4 5 6 7 Total Print 275 350 250 300 280 275 270 2,000 275 275 250 275 275 275 2401 References Forecast Output Regular Overtime Output. Forecast Cost Regular Overtime Total b. Would the total cost be less with full regular production each period with no overtime, but using a subcontractor to handle the excess above reqular capacity at a cost of $53 per hundred bolts? Backlogs are not allowed. The inventory carrying cast is $2 per 3 points b. Would the total cost be less with full regular production each period with no overtime, but using a subcontractor to handle the excess above regular capacity at a cost of $53 per hundred bolts? Backlogs are not allowed. The inventory carrying cost is $2 per hundred bolts. (Round your Average inventory values to 1 decimal place. Negative amounts should be indicated by a minus sign. Leave no cells blank.be certain to enter "O" wherever required.) . eBook Period 1 2 3 4 S 5 7 Total 1 Hint Forecast 275 350 250 300 280 275 270 2,000 275 275 275 275 275 275 240 Print Asteraners Output Regular Subcontracting Inventory Beginning Ending Average Cost Regular Subcontracting Inventory Total

Step by Step Solution

There are 3 Steps involved in it

1 Expert Approved Answer
Step: 1 Unlock blur-text-image
Question Has Been Solved by an Expert!

Get step-by-step solutions from verified subject matter experts

Step: 2 Unlock
Step: 3 Unlock

Students Have Also Explored These Related General Management Questions!