

Question: Please explain step by step Type the following code in Matlab and see the results. X = -2 pi: 0.1: pi 2: step heaviside (X):
Please explain step by step 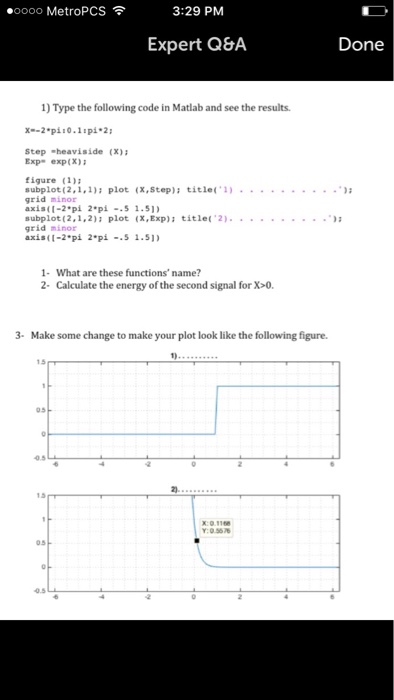
Type the following code in Matlab and see the results. X = -2 pi: 0.1: pi 2: step heaviside (X): Exp = exp(X): figure (1): subplot (2, 1, 1): plot (X, step): title ('1)...'): grid minor axis ((-2 pi 2 pi -.5 1, 5)) subplot (2, 1, 2): plot (X, Exp): title ('2)...): grid minor axis ((-2 pi 2 pi -.5 1.5)) What are these functions' name? Calculate the energy of the second signal for X > 0. Make some change to make your plot look like the following figure
Step by Step Solution
There are 3 Steps involved in it
1 Expert Approved Answer
Step: 1 Unlock

Question Has Been Solved by an Expert!
Get step-by-step solutions from verified subject matter experts
Step: 2 Unlock
Step: 3 Unlock