Question: Please help find MAD ,MAPE (%), Ts Range ( mix and MAx) Absolute Error Mean Squared Error At MSET MADt % Error MAPET TSI Period

Please help find MAD ,MAPE (%), Ts Range ( mix and MAx) Please help find MAD ,MAPE (%), Ts Range ( mix

Absolute Error Mean Squared Error At MSET MADt % Error MAPET TSI Period t 0 1 2 3 4 5 6 7 8 9 10 11 12 Demand Forecast Dt Level Lt Ft Error Et 22,083 8,000 20.675 22,083 14.083 13,000 19,908 | 20,675 7,675 23.000 20.217 19,908 -3,093 34,000 21,595 20,217 -13.783 10,000 20,436 21.595 11.595 18,000 20,192 20.436 2.436 23,000 20,473 20.192 -2.808 38,000 22,226 20,473 -17,527 12,000 21.203 22.226 10.226 13,000 20,383 21,203 8,203 32,000 21,544 20.383 -11,617 41,000 23,490 21,544 -19,456 23,490 14,083 7,675 3,093 13,783 11,595 2,436 2,808 17,527 10,226 8,203 11.617 19,456 198,340,278 58,905,625 9,563,556 189,977,981 134,445,764 5,931,989 7,884,804 307,202,401 104,561,437 67,288,813 134,962, 165 378,519.966 14,083 10,879 8,284 9,659 10.046 8,777 7,925 9.125 9,247 9,143 9.368 10.208 9,423 176 59 13 41 116 14 12 46 85 63 36 47 176 118 83 72 81 70 62 60 62 63 60 59 1.00 2.00 2.25 0.51 1.64 2.15 2.03 -0.16 0.95 1.86 0.58 -1.38 -1.492740526 0 a 0.1 50000 Forecast Errors for Tahoe Salt Forecasting 40000 300002 Demand TS Range Min | Max : MAD AN A MAPE(%) Forecast 20000 Forecasting Method Static Mix Method Four-period moving average Simple exponential smoothing 10000 0 1 1 1 2 1 10 3 4 4 5 8 6 7 8 11 12 Tahoe Salt Forecasts Using Simple Exponential Smoothing

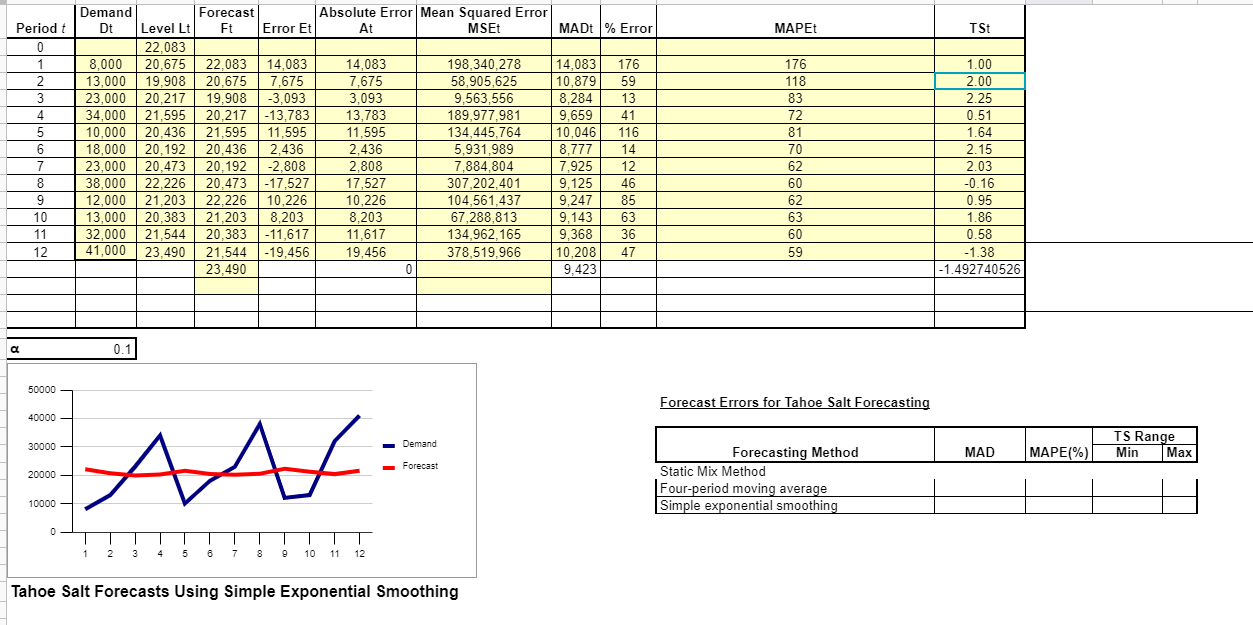
Step by Step Solution

There are 3 Steps involved in it

1 Expert Approved Answer
Step: 1 Unlock blur-text-image
Question Has Been Solved by an Expert!

Get step-by-step solutions from verified subject matter experts

Step: 2 Unlock
Step: 3 Unlock

Students Have Also Explored These Related General Management Questions!