

Question: Please help. Floor Space (sq. ft. ) Weekly Sales (dollars) 6, 060 16, 380 5, 230 14,400 4, 280 13, 820 5,580 18,230 5,670 14,
Please help.
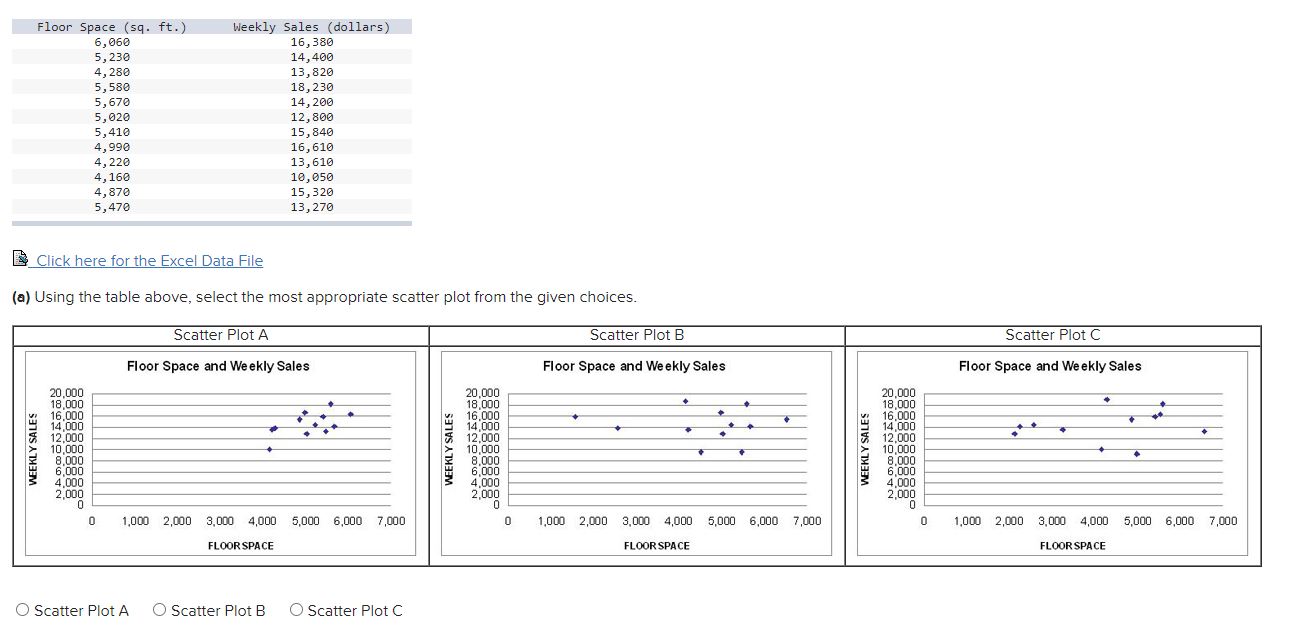
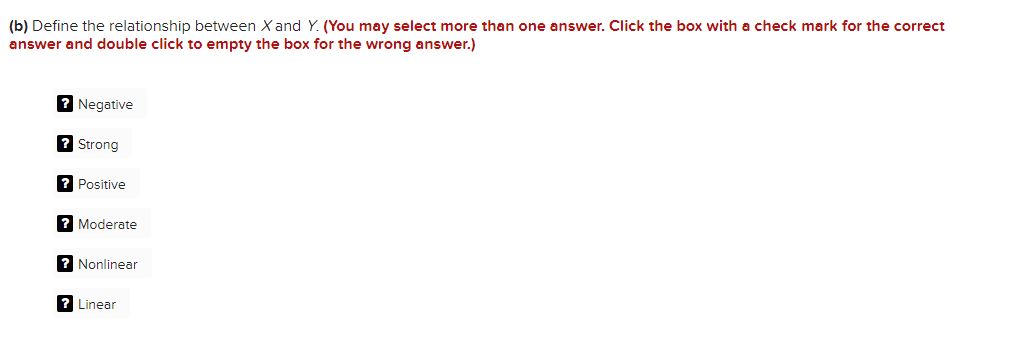
Floor Space (sq. ft. ) Weekly Sales (dollars) 6, 060 16, 380 5, 230 14,400 4, 280 13, 820 5,580 18,230 5,670 14, 200 5,020 12, 800 5, 410 15, 840 4,990 16, 610 4, 220 13, 610 4, 160 10, 050 4,870 15, 320 5,470 13, 270 Click here for the Excel Data File (a) Using the table above, select the most appropriate scatter plot from the given choices. Scatter Plot A Scatter Plot B Scatter Plot C Floor Space and Weekly Sales Floor Space and Weekly Sales Floor Space and Weekly Sales 20,000 20,000 20,000 18,000 18,000 18,000 16,000 16,000 16,000 14,000 14,000 14,000 12,000 12,000 12,000 WEEKLY SALES 10,000 10,000 WEEKLY SALES 10,000 8,000 8,000 8.000 6,000 6,000 6,000 VEE 4,000 4.000 4.000 2,000 2,000 2,000 0 0 1,000 2,000 3,000 4,000 5,000 6,000 7,000 0 1,000 2,000 3,000 4,000 5,000 6,000 7,000 0 1,000 2,000 3,000 4,000 5,000 6,000 7,000 FLOOR SPACE FLOOR SPACE FLOOR SPACE O Scatter Plot A O Scatter Plot B O Scatter Plot C(b) Define the relationship between X and Y. (You may select more than one answer. Click the box with a check mark for the correct answer and double click to empty the box for the wrong answer.) 7 Negative ? Strong ? Positive ? Moderate ? Nonlinear ? Linear
Step by Step Solution
There are 3 Steps involved in it

Get step-by-step solutions from verified subject matter experts